The LPL Research team provides in-depth analyses, insights, and perspectives on the second half of 2023.
At LPL Research, our 2023 investing outlook started with a theme of returning to normalcy. Considering 2022’s market volatility and the aftereffects of the pandemic, the idea of finding balance was certainly a welcomed change. It’s a theme we could all embrace six months ago and what we will continue to rally around through year-end.
That’s not to say that 2023 hasn’t come with its own set of challenges. We saw two regional banks fail in rapid-fire succession in March—and another closed its doors in May. Collectively representing over $530 billion in assets, the trio ranks as the second, third, and fourth largest bank failures to date.
We also held our breath as a last minute deal to raise the debt limit came together as the clock ticked closer to default. Despite the market gyrations these events caused and a banking sector still on tenterhooks, the overall financial system seems stable. Counterbalancing the challenges, some bright spots include:
Inflation is under 5% at home, significantly lower than its 8.3% level this time last year
The fed funds rate is approaching its apex as the Federal Reserve grapples with the unknown impacts yet to emerge from its aggressive tightening cycle
Global inflation has ticked down from its 8.7% high in 2022, and is following a slow descent to a projected 6.5% for 2023
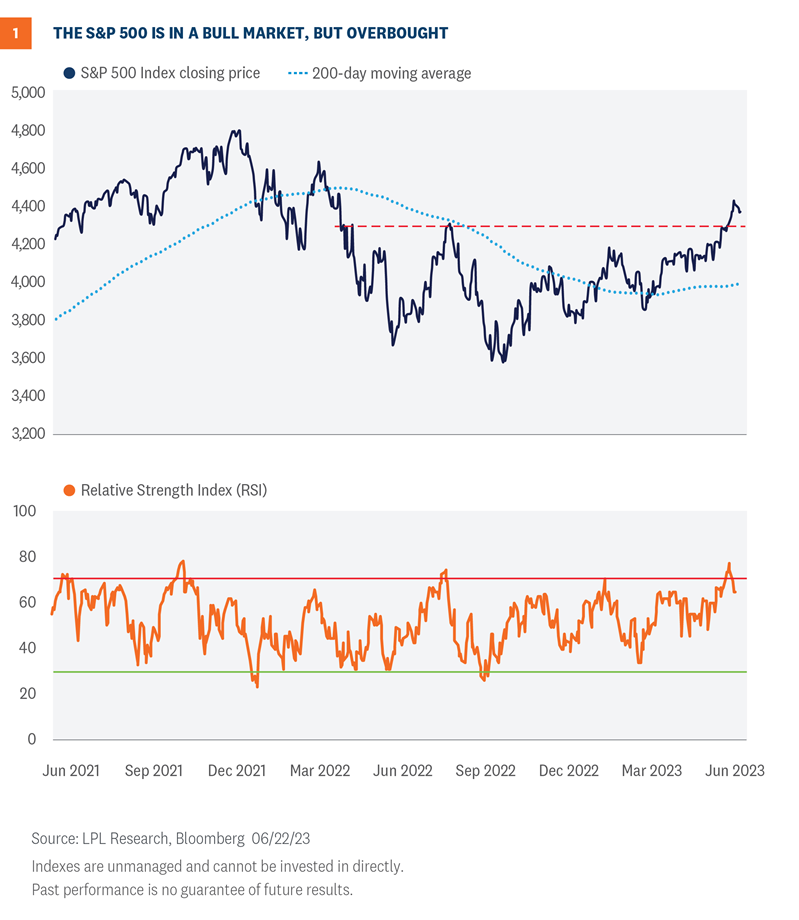
We know it’s old news at this point, but on June 8, 2023, the S&P 500 entered a new bull market. After such a strong rally off the October lows, this young bull probably needs a breather. A look at the charts suggests this market may be due for a pause. Bull markets are not linear. However, the impending end of the Federal Reserve (Fed) rate-hiking campaign, and the economy’s and corporate America’s resilience, help make the bull case that steers LPL Research toward a neutral, rather than negative, equities view from a tactical asset allocation perspective.
New Bull Market Has Arrived
The S&P 500 has climbed into bull market territory after rallying more than 20% off the October 2022 lows, establishing October 12, 2022, as the bear market low. It took 165 trading days for the S&P 500 to surpass the 20% threshold off that bear market low, marking the second longest period to confirm a new bull market in nearly 75 years.
While the 20% qualifier meets the technical definition of a bull market, there is additional evidence supporting the transition from a bear to bull market. First, demand for equities continues to rise, forming a series of higher highs and higher lows since October. This uptrend has further been validated by the S&P 500 Index crossing back above its longer-term 200-day moving average (dma).
Second, while leadership remains narrow, participation in this year’s rally has been cyclical. Communication services, consumer discretionary, industrials, and technology enjoy the best sector breadth and the highest percentage of stocks outperforming the market this year. Meanwhile, defensive sectors, such as consumer staples and utilities, continue to underperform with relatively weak sector breadth.
Lastly, bull markets are not linear, and with the S&P 500 well extended above its uptrend, we suspect a pullback or pause is likely. The S&P 500’s Relative Strength Index (RSI)—a momentum oscillator used to measure the speed and magnitude of price action—recently reached its most overbought reading since November 2021 (Figure 1).
However, the good news with a bull market is that mean reversion from overbought levels is typically resolved near the market’s longer-term uptrend. For the S&P 500, that technically means investors could see pullback opportunities toward the rising 200-dma (3,991) over the coming months.
Following the playbook
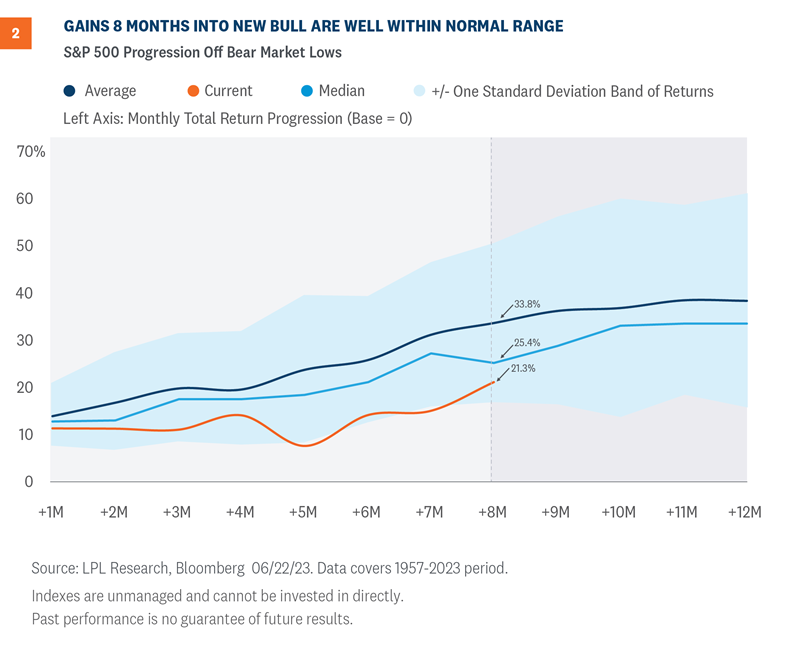
This rally seems quite powerful based on the eight month move, but it’s really quite ordinary for an early-stage bull market. In fact, the average price gain for an eight-month-old bull market for the S&P 500 is 33.8%, based on nearly 70 years of history (Figure 2). The median performance, at 25.4%, is a better representation of where stocks might normally be at this stage because it takes out the ferocious V-shaped rebounds coming out of the 2008-2009 Great Financial Crisis and the early stages of the pandemic in March 2020. With a roughly 21% price gain so far for this young bull, S&P 500 performance is well within the normal historical range.
Where we might go from here
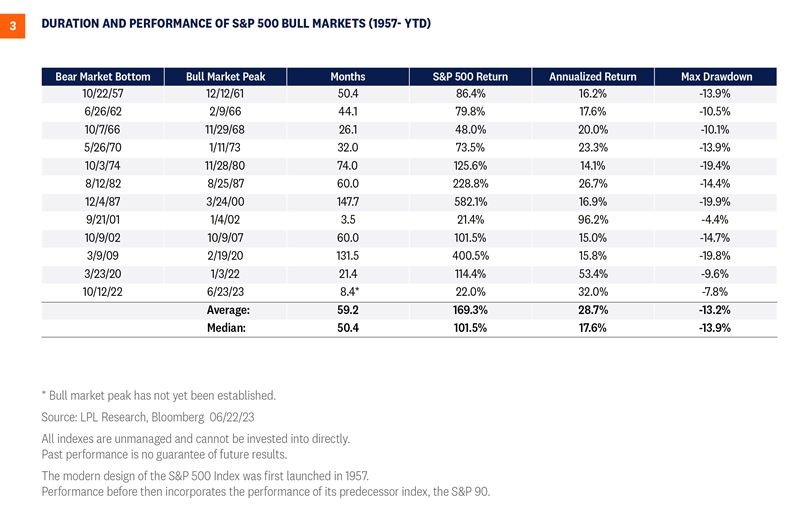
Of course, we don’t know when the next bear market will arrive, but based on history, there is a good chance it doesn’t show up for quite a while. The duration of a bull market can vary significantly, but historically they have been long-lasting. Since 1957, the average S&P 500 bull market has lasted 59.2 months and produced an average cumulative gain of 169.3% (Figure 3). However, bull markets are not linear and have experienced average maximum drawdowns of 13.2%, similar to the average maximum S&P 500 drawdown in any year of 14.3%.
Investment outlook
Stocks have had a strong rally over the past eight months to establish a new bull market. With the broad market overbought in the short-term from a technical analysis perspective and valuations elevated, stocks may be due for a pause. At the same time, the resilience of the U.S. economy and corporate America has been impressive. Our base case calls for a mild and short-lived recession to begin by year-end, but the latest economic data have slightly raised the odds of a soft landing. Moreover, a Fed pause is likely coming soon, if it’s not already here, supporting the bull case for equities and a neutral, rather than negative view.
LPL’s Strategic and Tactical Asset Allocation Committee (STAAC) recommends a neutral tactical allocation to equities, with a modest overweight to fixed income funded from cash. The risk-reward trade-off between stocks and bonds looks relatively even to us (as we wrote about here recently), with core bonds providing a yield advantage over cash. Also consider a Fed pause has historically been a positive for core bond investors, though the exact timing for that remains uncertain.
The STAAC recommends being neutral on style, favors developed international equities over emerging markets and large caps over small, and maintains the industrials sector as the top overall sector pick, with communication services and technology as top ideas based on technical analysis.
Within fixed income, the STAAC recommends an up-in-quality approach with a benchmark weight to duration. We think core bond sectors (U.S. Treasuries, agency mortgage-backed securities (MBS), and short-maturity investment grade corporates) are currently more attractive than plus sectors (high-yield bonds and non-U.S. sectors) with the exception of preferred securities, which look attractive after having sold off due to stresses in the banking system.
Jeffrey Buchbinder, CFA, Chief Equity Strategist
Adam Turnquist, CMT, Chief Technical Strategist
https://www.rwmfinancialgroup.com/wp-content/uploads/2023/01/weekly-market-commentary-december-12.png450450R.W.M. Financial Grouphttps://www.rwmfinancialgroup.com/wp-content/uploads/2022/09/RWM_Brand-Identity_RGB_Wordmark_Color-1030x883.pngR.W.M. Financial Group2023-06-26 09:51:332023-06-26 09:51:36The New S&P 500 Bull Needs a Breather
As the economy is likely downshifting, investors should take heed that the Federal Reserve’s (Fed) current stance is eerily similar to early 2007. During that time, the Fed held a tightening bias since they believed the housing market was stabilizing, the economy would continue to expand, and inflation risks remained. Clearly, their expectations were not met as the economy soon fell into recession. That’s not suggesting another 2008 is coming, but rather highlights how fast the economic environment can change.
Overview
Forecasting regime shifts are difficult for both public policymakers and private investors. The macro-environment will likely experience a shift in the coming months as consumers retrench and businesses slow hiring. Despite emerging signs of slowing, the Fed recently communicated a hawkish stance on the path of interest rates going forward and the markets seemed to take it all in stride.
At the conclusion of the June 13-14 meeting, the Federal Open Market Committee (FOMC) kept rates unchanged but communicated a hawkish bias toward future interest rate decisions. Committee members were intent on further tightening but expressed concerns over unknown risks yet to emerge from the cumulative tightening over the past year. During the post-meeting press conference, Fed Chairman Jerome Powell indicated the Committee has not made a decision about next month, but if economic conditions hold steady, investors should pencil in a 0.25% increase to the Fed funds rate.
Along with the statement, the Committee updated the Summary of Economic Projections (SEP), which is arguably more important than the brief monetary policy statement. Within the most recent SEP, most policymakers believe further tightening is needed unless conditions materially weaken.
Inflation is going in the right direction
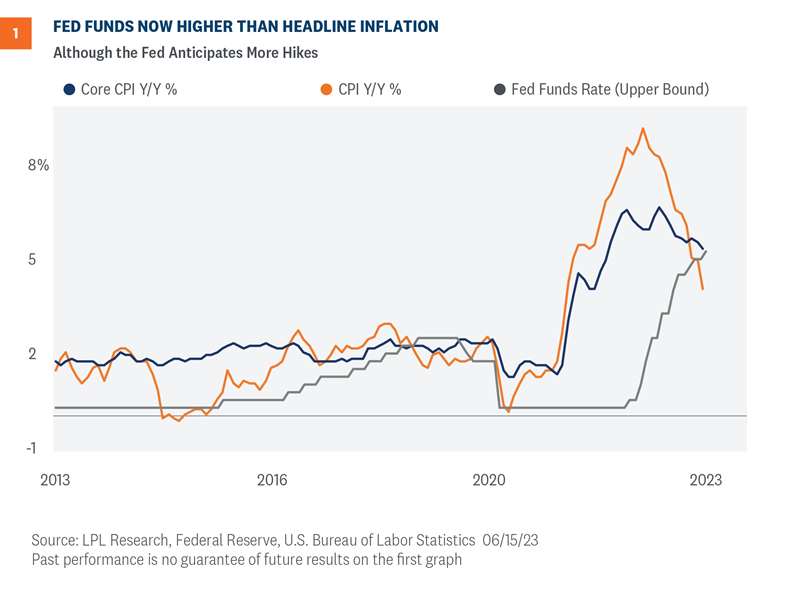
We think the Fed should consider the improving inflation outlook in addition to the other variables and concerns they’ve already stated. The latest Consumer Price Index (CPI) print decelerated toward the lower end of expectations, with overall headline inflation falling to the lowest level since April 2021. The encouraging trend in consumer prices will provide the Fed some leeway throughout the balance of 2023. Investors seem to believe the latest CPI report shows inflation is heading in the right direction and likely reinforced the Fed’s decision to skip a June rate hike or even pause for a longer period. As shown in Figure 1, headline inflation is below the fed funds upper bound, although core inflation is not decelerating as fast as headline inflation.
And perhaps that’s why equity markets added to recent gains over recent trading days, despite the disappointment that no Fed official thought conditions would warrant an outright cut in rates.
Fed should anticipate further easing in rents
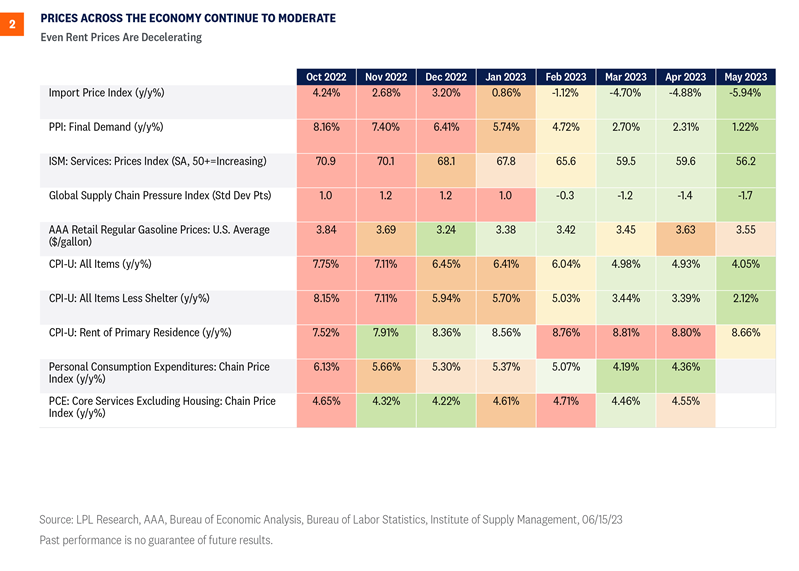
The housing sector is currently a significant factor impacting inflation in 2023. Shelter costs, which hold a significant weight in the CPI, are expected to ease. There is evidence rent costs will eventually decrease, as can be seen in the robust multi-family construction activity. As more projects hit the market this year due to the increase in condo and apartment units under construction, the supply of multi-family housing will rise, which should help bring down rent prices. As such, we don’t think it will be long before official government numbers reflect the decrease in rent prices. In the upcoming months, investors and policymakers alike should anticipate a slowing of housing-related inflation.
We have updated our Inflation Dashboard (Figure 2), designed to provide a snapshot of the inflationary environment, with the latest CPI data. The CPI rent of primary residence is the only one of our dashboard indicators that remains at an elevated level, and even that has fallen from an extreme level since April.
A lot can change in a few quarters
So, why bring up a Fed statement from 2007? Because it’s a good example of how radically the economy can change in just a few quarters. In the January 2007 statement, the Fed communicated a “hawkish pause” because they anticipated a stabilizing housing market, a growing economy, and nagging inflation risks. A lot changed over the course of 2007 and 2008 as the economy fell into the Great Financial Crisis.
The current SEP revised up GDP growth forecasts and softened the deterioration in unemployment, and it seems the Fed is reticent to forecast a recession. However, our most likely scenarios put the economy in a mild recession by the end of the year as consumers retrench and businesses slow hiring as surveys suggest.
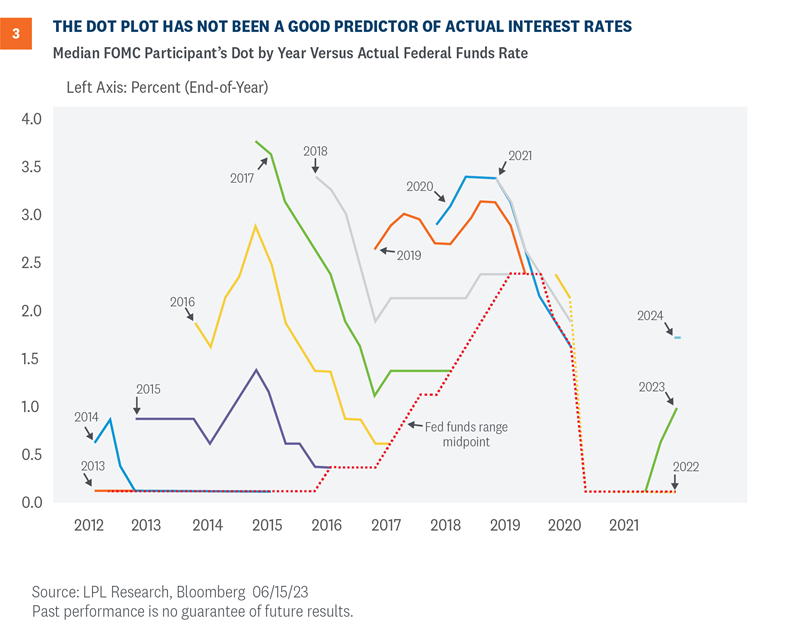
The release of the dot plot, which is the individual Committee member’s expectation of the appropriate fed funds rate each year, was the hawkish surprise markets were worried about. Despite raising rates by 5% over the past 15 months, the majority of the Committee, not just the median policymaker, sees at least two more 0.25% rate hikes this year, which would take the fed funds rate to 5.625%—the highest level since 2001. Moreover, the Committee thinks the fed funds rate should end 2024 at 4.625%, which reflects the potential for some rate cuts, but not as many as markets are expecting, which could put upward pressure on bond yields if those forecasts are accurate.
The Fed’s crystal ball is no better than the market’s and we know from history that the dot plot is not a good forecasting tool. As seen in Figure 3, the median forecast rarely, if ever, coordinated with actual policy rates (dashed red line). Dot plot medians tended to overestimate policy rates—sometimes by a wide margin. The most egregious example appears to be in 2015 (green line) when the Committee expected interest rates in 2017 to be above 3.5%, when in actuality they were closer to 0.50% that year. Nonetheless, it is worth watching how these views evolve in the coming months, which means either the Fed lowers its forecasts or the market adjusts higher, putting upward pressure on bond yields.
Summary and investment outlook
Periods of economic regime shifts are difficult for policymakers to manage. This current environment could be eerily similar to early 2007, when the Fed held a tightening bias on rates as they believed the housing market was stabilizing, the economy would continue to expand, and inflation risks remained. Both the January 2007 statement and the most recent one last week specifically mention the FOMC’s process in determining the extent of additional policy firming that may be needed. Clearly, those expectations were not met since we know what happened in later quarters. Despite the reference to 2007, our baseline is the economic slowdown does not produce another “2008,” yet investors should anticipate some volatility as the economic outlook remains cloudy.
With the Fed seemingly pushing out rate cuts, markets are probably going to be volatile over the next few quarters or at least until the inflationary story becomes clearer. LPL’s Strategic and Tactical Asset Allocation Committee (STAAC) recommends a neutral tactical allocation to equities, with a modest overweight to fixed income funded from cash. The risk-reward trade-off between stocks and bonds looks relatively even to us (as we wrote about here recently), with core bonds providing a yield advantage over cash. Moreover, as we wrote in our May 22 Weekly Market Commentary, despite the continued uncertainty around timing, a Fed pause has historically been a positive for core bond investors.
The STAAC recommends being neutral on style, favors developed international equities over emerging markets and large caps over small, and maintains the industrials sector as the top overall sector pick, with communication services and technology as top ideas based on technical analysis.
Within fixed income, the STAAC recommends an up-in-quality approach with a benchmark weight to duration. We think core bond sectors (U.S. Treasuries, agency mortgage-backed securities (MBS), and short-maturity investment grade corporates) are currently more attractive than plus sectors (high-yield bonds and non-U.S. sectors) with the exception of preferred securities, which look attractive after having recently sold off due to the banking stresses.
Jeffrey Roach, PhD, Chief Economist
Lawrence Gillum, CFA, Chief Fixed Income Strategist
The Federal Reserve (Fed) meets this week where it is largely expected to not raise short term interest rates for the first time in 15 months. However, Fed messaging has been all over the place in recent weeks. While some Fed officials continue to advocate for additional rate hikes, others want to be more patient. So, according to current market pricing anyway, the Fed is expected to skip the June meeting before hiking again in July which could mark the starting point for an extended pause. It can be very confusing to markets at times. And throw in the glut of Treasury issuance expected to come to the market and the Fed is likely going to continue to stay in the news for the foreseeable future. The good news? We agree with markets that the end of the rate hiking campaign is near, which has historically been a good thing for core bond investors.
The Fed’s Message to Markets: We’ll Skip on June 14
Expectations for a June 14 rate hike remain low and were firmly cemented by Fed Governor Philip Jefferson’s direct comments on May 31 that the Federal Open Market Committee (FOMC) should “skip” a meeting before making a rate determination. What is especially interesting to Fed watchers is the sudden shift in the fed funds futures market regarding the probability of a rate hike. Early in the day on May 31, Loretta Mester, President of the Cleveland Fed, noted that there was “no compelling reason to wait before implementing another rate rise,” which propelled the futures probability of a 0.25% rate hike on June 14 dramatically higher.
Shortly afterwards, Philip Jefferson, nominated in May to become the Fed’s vice chair, said that “skipping a rate hike” would give the Fed additional time to assess economic conditions before deciding on the direction of rates. Within minutes, the futures market dropped markedly and has stayed in a range that suggests there won’t be a June rate hike. Jefferson has been advocating for the FOMC to “pause” in its rate hiking campaign, allowing the cumulative effect of the previous 5.0% of hikes to flow through the broader economy, which can take many months.
Jefferson’s shift toward a “skip” represents the views of Fed Chair Jerome Powell, who has emphasized that the Fed remains data dependent as it continues on the monetary path towards restoring “price stability.” Moreover, Powell has repeatedly reminded financial markets that future rate hikes remain in play if inflationary pressures do not edge lower on a more sustainable basis. The Fed can, at any time before June 14, telegraph to financial markets there will be a rate a hike, but it is not expected. Powell has always emphasized the importance of preparing markets, businesses, and consumers for additional rate hikes so they can prepare accordingly.
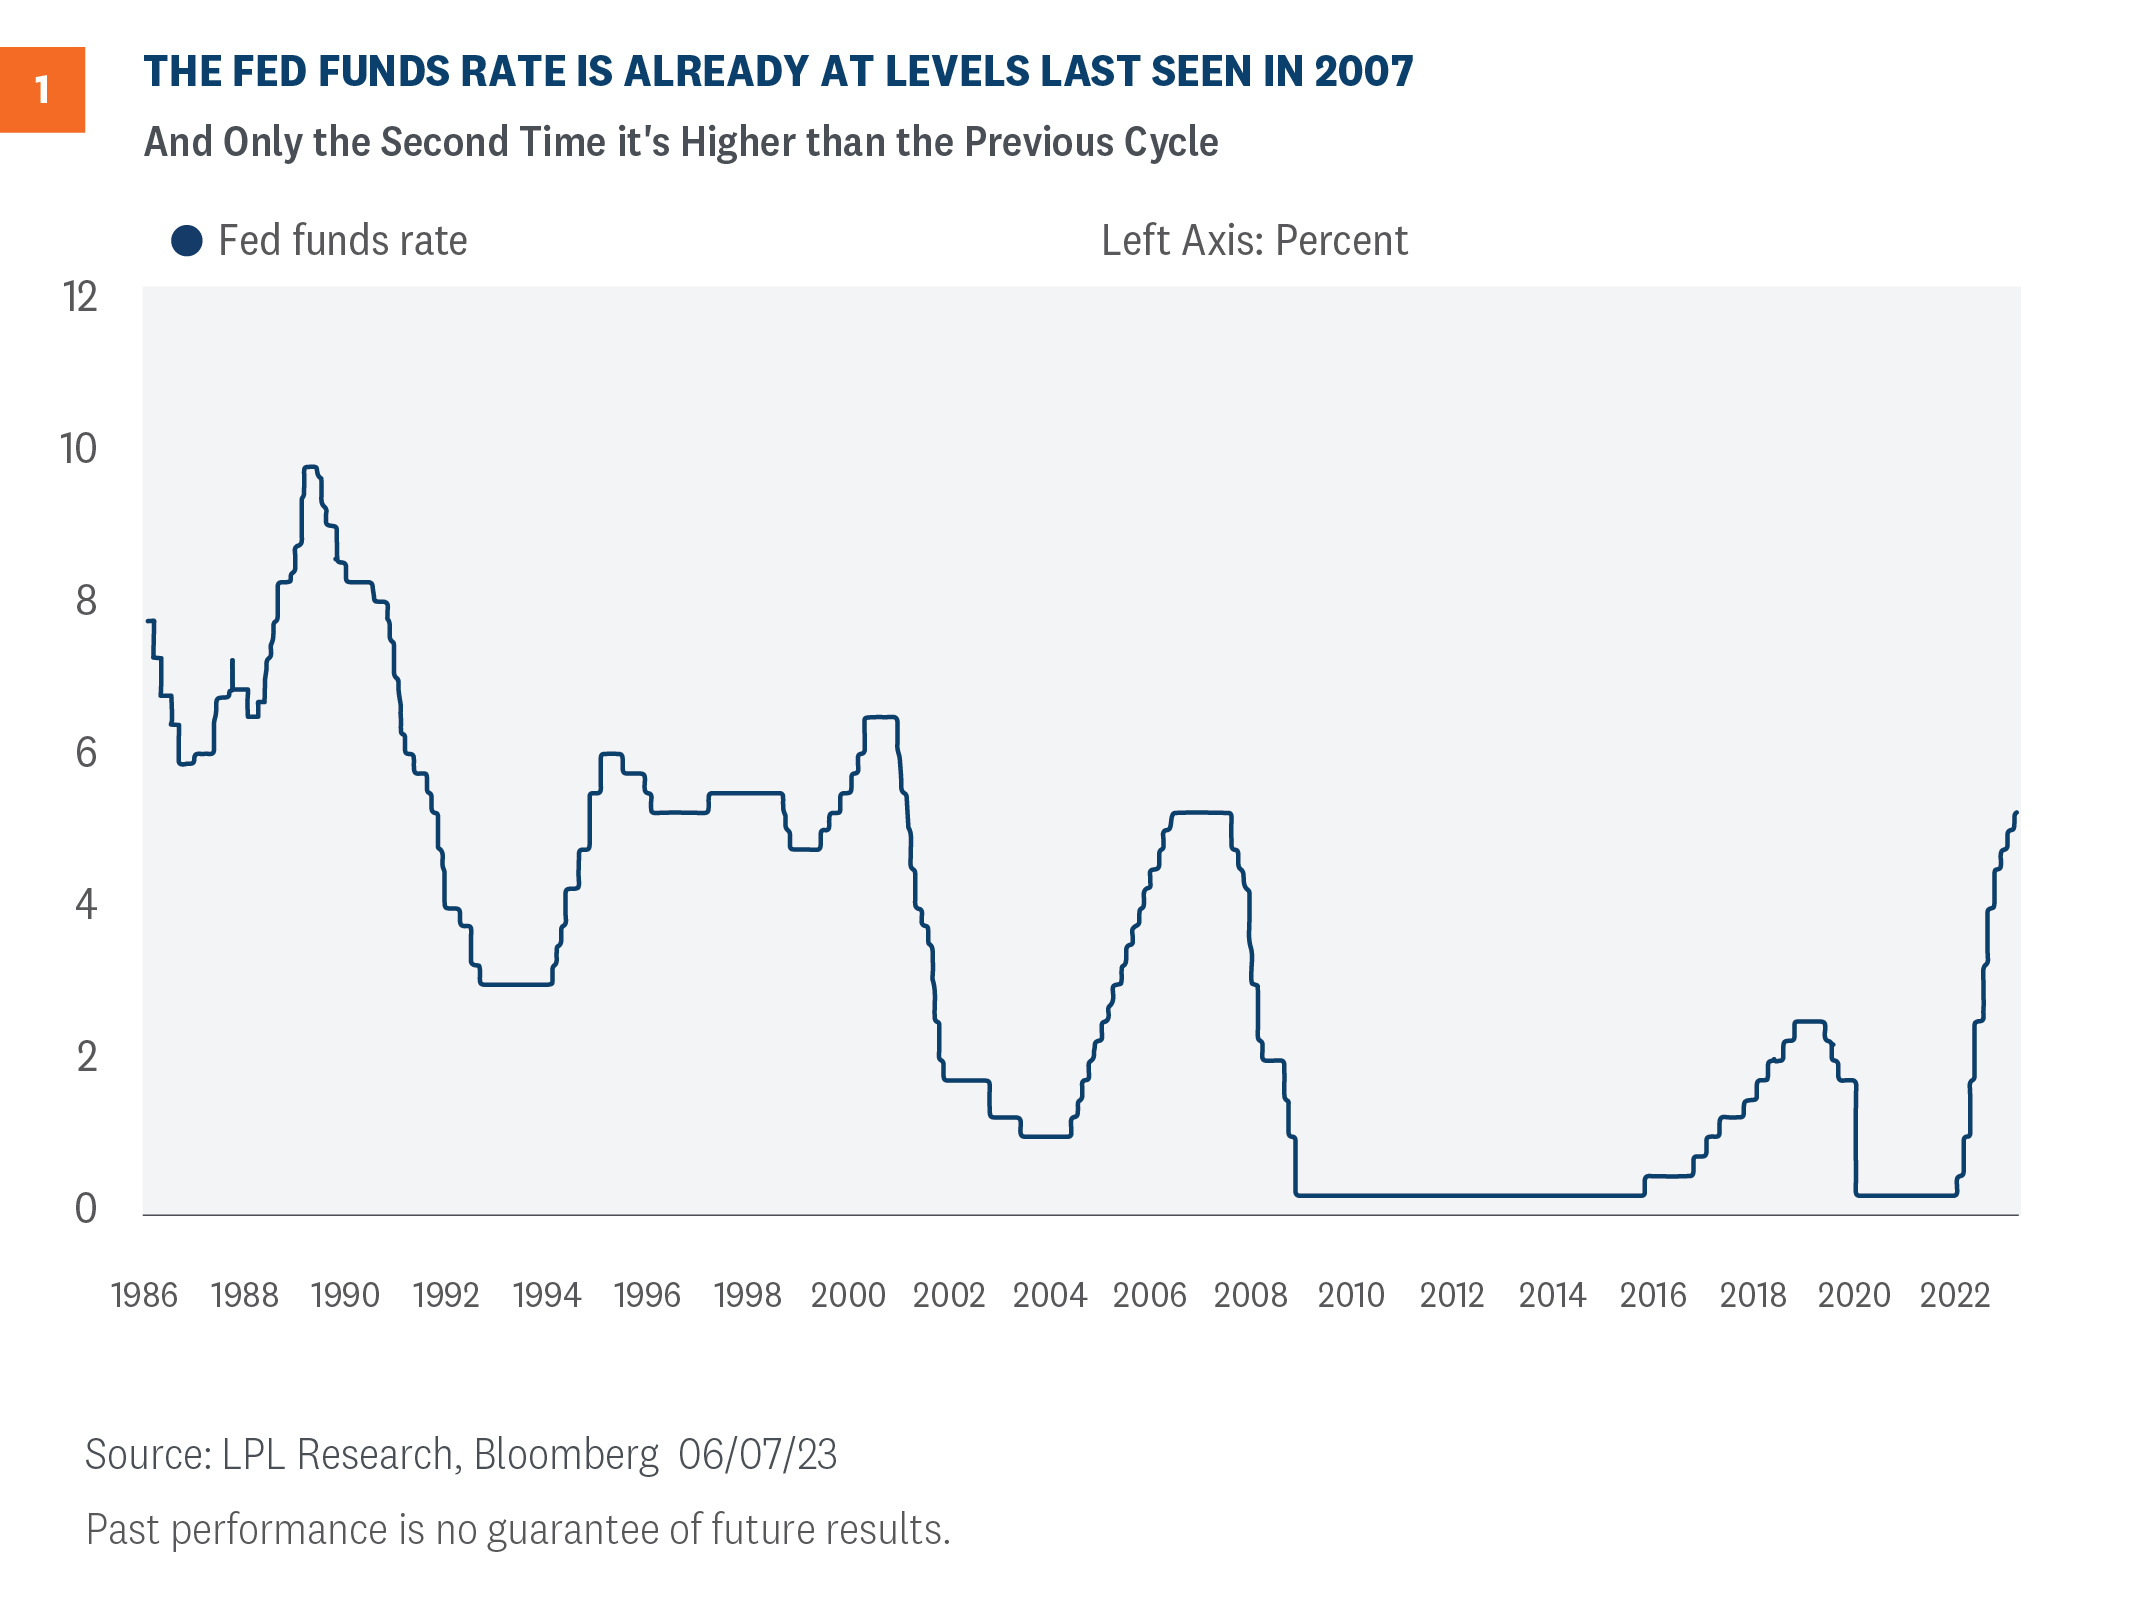
As seen in Figure 1, the Fed has already done a lot of work trying to normalize interest rates with rates at levels last seen in 2007. Moreover, the current rate hiking campaign is only the second time the Fed has been able to get the fed funds rate higher than the previous rate hiking cycle without impairing financial stability. Continuing at its current pace increases the likelihood that something “breaks,” further justifying a pause or skip, in our view.
Concerns Under the Fed’s Radar
There are a host of potential risks the Fed is monitoring, including the ability to secure loans as banks have raised lending standards. Currently, there have been anecdotal reports that property developers are having a difficult time obtaining loans for large scale projects. As the Fed assesses the strength of the economy, consumers continue to spend, but more deliberately. If the labor markets weaken and the unemployment rate climbs materially higher, consumer spending should slow meaningfully. Representing nearly 68% of GDP, consumers have accepted higher prices from a broad range of companies, but if unemployment rises to levels reflecting recessionary conditions, spending would likely slow dramatically.
A more immediate issue for the Fed is the Treasury Department’s need to replenish its General Account. The Treasury held back issuing nearly $850 billion in debt during the debt ceiling negotiations. Issuance of approximately $1.1 trillion worth of Treasury notes will be sold through the end of September. The Fed will monitor the process to make certain there aren’t any dislocations which would require action by the Fed. Many analysts are concerned about liquidity in financial markets dissipating at a faster pace as the auctions continue. Most bond traders don’t expect this, but if there are pockets of illiquidity, the expectations are the Fed will step in immediately.
While every indication suggests that a June 14 rate hike is off the table, the probability for another move higher by the FOMC by the July 26 meeting is slightly above 50%. The Fed remains data dependent, as does the market, but the most important gauge will come from inflation-related data. Jerome Powell is determined to reduce inflation to acceptable levels so the Fed’s credibility remains intact.
Beware of the Dot Plot
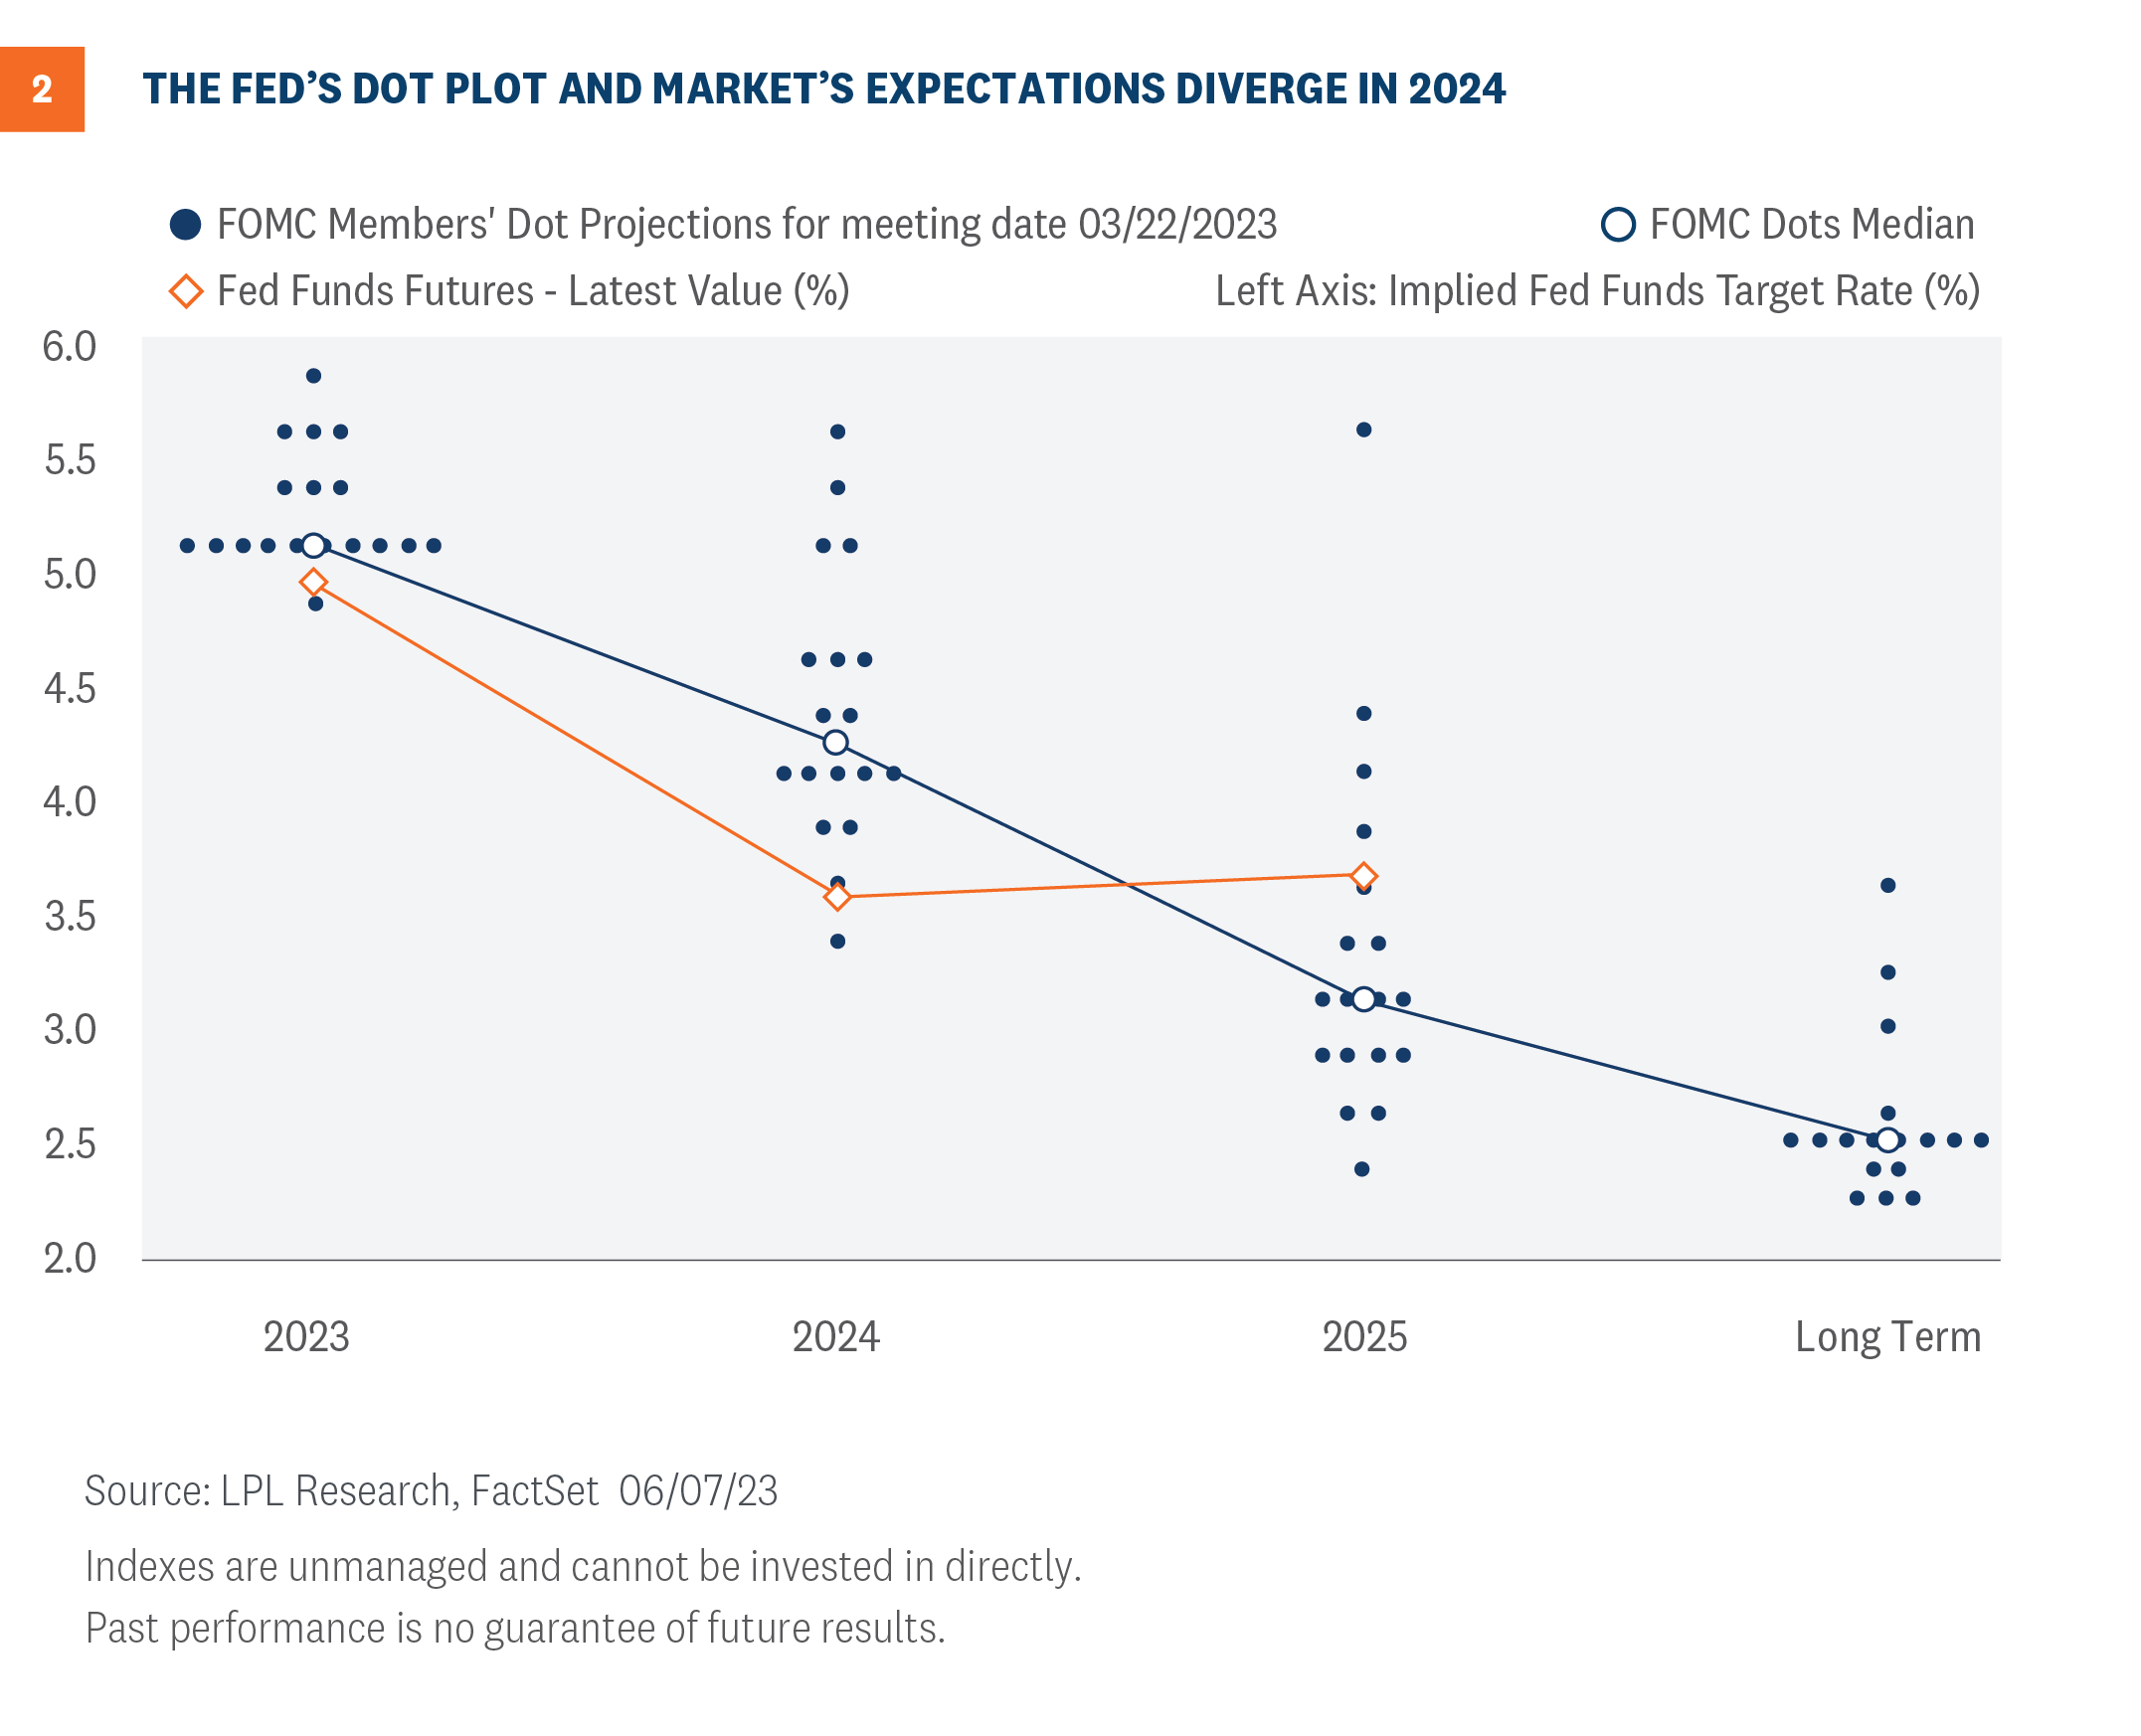
Looking out into 2024, markets and the Fed continue to disagree about how long a pause is expected before cuts take place. Along with the interest rate decision, the Fed will release its summary of economic projections (SEP). The SEP release, which occurs four times a year, includes forecasts for economic growth, inflation, and interest rates, colloquially known as the “dot plot.” The dot plot, which is the individual committee member’s expectation of the appropriate fed funds rate each year, will likely show a terminal rate of around 5.25% or 5.5%—likely not too different from the March release—but the real risk to markets could come if 2024 projections increase (or at least don’t decrease). As seen in Figure 2, market expectations (as proxied by fed funds futures) already differ from Fed median expectations, so if the Fed projects still higher rates, or at least fewer rate cuts, into 2024, markets may have to reprice as well, which could put upward pressure on bond yields.
Investment Implications
LPL’s Strategic and Tactical Asset Allocation Committee (STAAC) now recommends a neutral allocation to equities, with a modest overweight to fixed income funded from cash. The risk-reward trade-off between stocks and bonds looks relatively even to us (as we wrote about here last week), with core bonds providing a yield advantage over cash. Moreover, as we wrote in our May 22 Weekly Market Commentary, a Fed pause has historically been a positive for core bond investors.
The STAAC recommends being neutral on style, favors developed international equities over emerging markets and large caps over small, and maintains the industrials sector as the top overall sector pick, with communication services and technology as top ideas based on technical analysis.
Within fixed income, the STAAC recommends an up-in-quality approach with a benchmark weight to duration. We think core bond sectors (U.S. Treasuries, Agency mortgage-backed securities (MBS), and short-maturity investment grade corporates) are currently more attractive than plus sectors (high-yield bonds and non-U.S. sectors) with the exception of preferred securities, which look attractive after having recently sold off due to the banking stresses.
Quincy Krosby, PhD, Chief Global Strategist
Lawrence Gillum, CFA, ChiefFixed Income Strategist
Stocks have had a nice run, but at higher prices, the bar for further gains gets higher. We have recently made the case in this publication that there are a lot of reasons to expect the market to go higher between now and year-end. But with stocks at higher valuations, high-quality bonds offering attractive yields, an S&P 500 Index with concentrated leadership facing technical resistance at 4,300, and an elevated risk of a late-2023 recession, we think it makes sense to be a bit careful here. Importantly, though, neutral is not bearish.
Five reasons we’re lowering our equities allocation
There are five primary reasons why the LPL Research Strategic and Tactical Asset Allocation Committee (STAAC) is lowering its recommended equities allocation to neutral today.
Reason #1: Recession Is Likely by Year End
Our base case is for the economy to slip into a mild recession by the end of 2023. However, the solid labor market and elevated surplus savings are delaying the onset of a broad-based contraction. Despite Friday’s strong jobs report, cracks are appearing. The latest Federal Reserve (Fed) Beige Book revealed a recession already started in the trucking and freight industries, and perhaps this is a leading indicator of a broader slowdown in business activity in the months ahead.
If and when a recession begins, the impact on capital markets will likely be mixed since some sectors could skirt the full impact of an economic contraction as upper-income households release pent-up demand for experiences within the services economy. The average loss for the S&P 500 during the six months before a recession has been 1.4% historically, based on data since 1970, though the index did gain nearly 10% ahead of the 1980 and 1990 recessions.
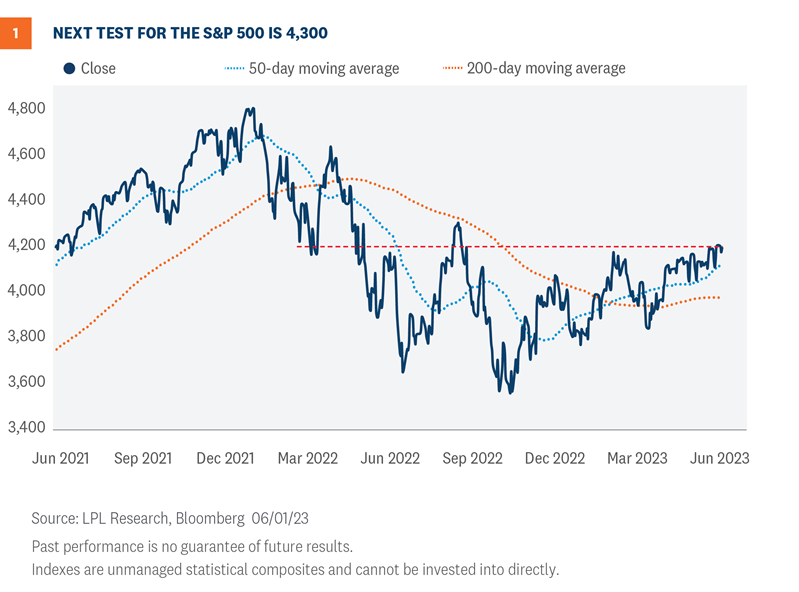
Reason #2: The S&P 500 Is Facing Strong Technical Resistance
The technical setup for the S&P 500 is a story of the good, the bad, and the ugly. The good news is that the market remains in an uptrend and above its rising 50- and 200-day moving averages (dma). Furthermore, after several failed attempts, the index finally surpassed resistance at 4,200 (Figure 1).
The bad news is that the next major area of resistance sets up near 4,300, which traces back to the August 2022 highs and lines up with a key retracement level of last year’s bear market. With major resistance coming into play only marginally above current S&P 500 levels, we believe the reward-to-risk profile has become less attractive.
Diverging market breadth represents the ugly portion of the technical story. Fewer and fewer stocks are participating in the latest advance, while leadership is highly concentrated in only a handful of mega-cap names. For example, only 43% of S&P 500 stocks are trading above their 200-dma, compared to 79% when the market notched its February high. On an equal weighted basis—meaning every stock in the index carries the same weighting—the S&P 500 is only 1.5% higher on the year, highlighting how much heavy lifting the mega-caps have done for the index’s 11.5% year-to-date advance (as of June 2).
In a typical bull market or even a developing one, widespread participation provides confirmation of the uptrend’s strength and sustainability. When participation in the advance is limited, vulnerabilities emerge as the weight of the market’s advance falls on the shoulders of a limited number of stocks.
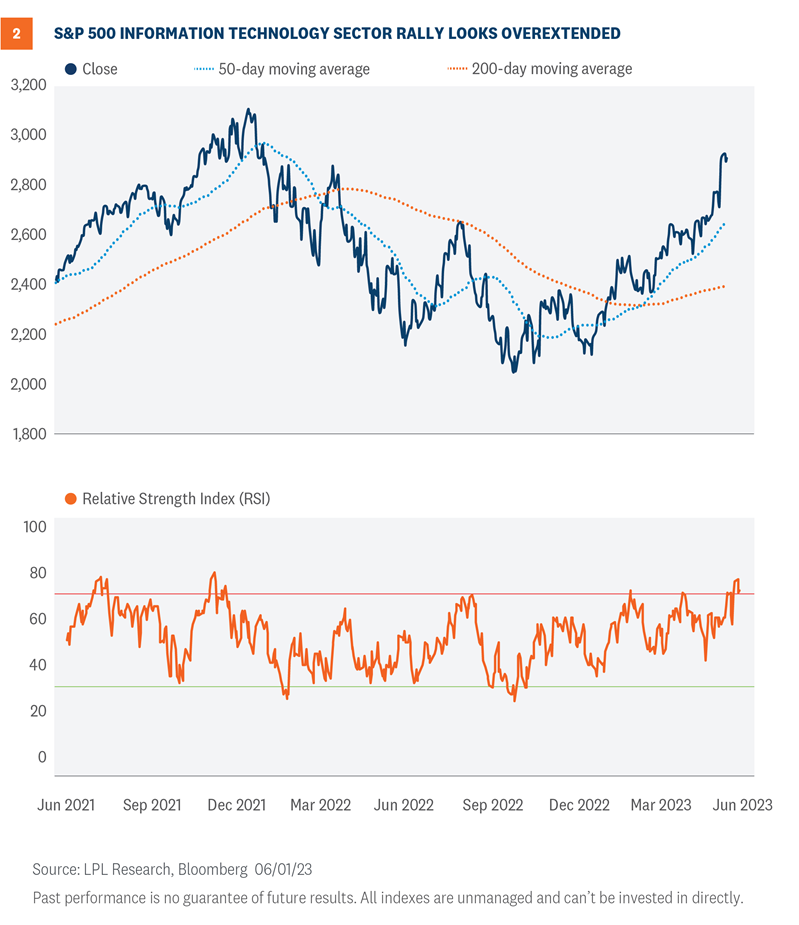
Reason #3: Technology Is Overbought and Due for Consolidation
Technology has been the main engine behind this year’s rally, and risk of the sector overheating continues to climb. Since the April 2023 low, the sector has rallied 16% as of June 1, marking the highest rate of change over a 26-trading-day period since February. In fact, whenever the rate of change has crossed above 16% over an equivalent timeframe, the technology sector has historically declined by an average of 2.5% over the following three-month period.
Overbought conditions are also becoming widespread. The sector’s Relative Strength Index (RSI)—a momentum oscillator used to measure the speed and magnitude of price action—recently hit its highest overbought reading since December 2021. Furthermore, nearly 30% of technology sector stocks reported an overbought RSI reading last week.
While overbought conditions provide validation of the sector’s uptrend, and overbought does not mean over, the likelihood of a healthy consolidation and/or pullback appears to be rising. The good news is that if there is mean reversion, it would likely be toward the sector’s uptrend and provide a potential pullback opportunity for investors seeking a better entry point into the sector. In the event of a pullback, both the rising 20- and 50-dmas provide dynamic support levels to watch, along with the August highs near 2,650 (Figure 2).
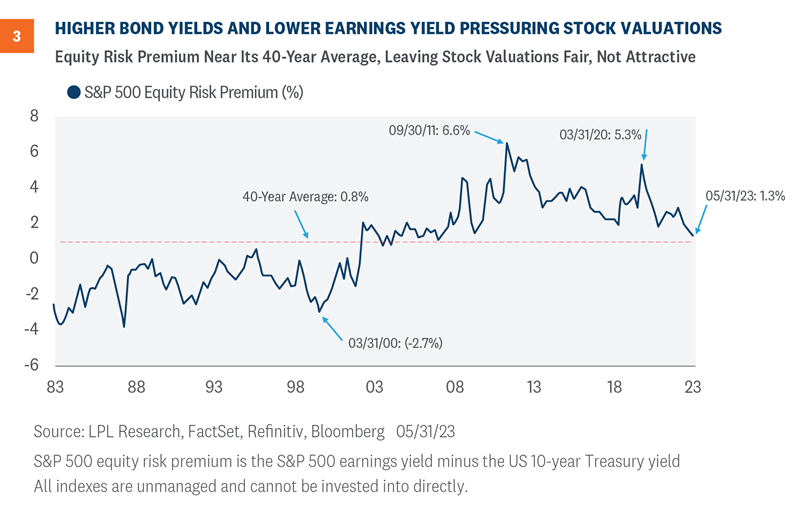
Reason #4: Fixed Income Yields Are More Competitive With Equities
Higher interest rates make stocks relatively less attractive when compared with bonds for a couple of primary reasons. First, the value of a stock is the present value of future cash flows. So, a higher interest rate raises the discount rate and lowers the value of those cash flows.
Second, higher interest rates also make bonds more attractive relative to stocks, all else equal. We use the equity risk premium (ERP) calculation shown in Figure 3 to compare the earnings from bonds (yield) to the earnings from stocks (earnings yield, or earnings divided by price). Based on the S&P 500 Index price and U.S. 10-Year Treasury yield as of May 31, the ERP is down to 1.3%, in line with the 40-year average and much richer than the near 3% ERP a year ago.
Friday’s strong jobs report increases the risk that interest rates move higher from current levels, as a potential July rate hike is back on the market’s radar. The increasing relative attractiveness of fixed income, coupled with fuller equity valuations, supported the STAAC’s decision to move to an overweight fixed income allocation and a neutral position on equities today.
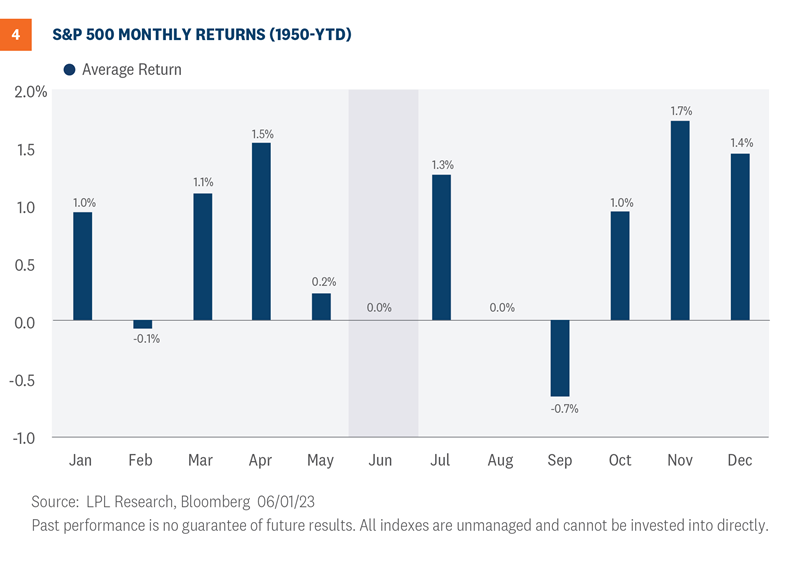
Reason #5: Seasonal Headwinds
Don’t expect any seasonal tailwinds to help stocks this month. The S&P 500 has generated average and median price returns during June of 0.0% and 0.1%, respectively, making it the fourth worst-performing month since 1950 (Figure 4).
Furthermore, the index has only produced positive returns 54.8% of the time during June. For context, the S&P 500 has posted average monthly gains of 0.7% and finished positive 61% of the time for all months since 1950.
The seasonal setup for the technology sector in June is even worse. Since 1990, the sector has generated average and median price returns during the month of 0.0% and -1.7%, respectively, making it the second-worst month based on average returns and the worst month based on median returns. Furthermore, the tech sector has only produced positive returns 42.4% of the time during June, the lowest positivity rate across the calendar.
Risks to the upside
Although we think stocks are due for a pullback, or at least some choppiness, there are several upside risks. One we highlighted last week was the stock market’s strong performance historically after a solid first 100 trading days (discussed here).
Other potential risks to the upside include:
The S&P 500 is still in a bear market (though barely), up 19.7% off its October 12, 2022 low, less than half the average gain one year after a bear market low of 42% since 1950 (the median gain is 34%). The technical definition of a bull market is a close 20% above the bear market low.
Stocks are still in the favorable third year of the four-year Presidential cycle—the S&P 500 has gained an average of about 15% in the year after midterm elections (and is up 11.9% since midterms on November 8, 2022).
After down years, as we had in 2022, the S&P 500 has historically gained an average of 15% in the subsequent year.
Inflation continues to fall steadily, which could help economic growth, company profit margins, and stock valuations by lowering borrowing costs, input costs, and the discount rate used to value stocks.
The end of the Fed’s rate hiking cycle could provide a tailwind for stocks. Historically, stocks have generated double-digit gains, on average, after the end of Fed rate hiking cycles, though in pre-1990 inflationary periods performance was more mixed.
A case can be made that recession was already priced in last fall and that a new bull market is developing, potentially eliminating the need for the S&P 500 to return to the October lows as in a typical recession scenario. During bear markets accompanied by recession since 1950, stocks have always bottomed after the recession started.
Latest thoughts on asset allocation
The STAAC now recommends a neutral allocation to equities, with a modest overweight to fixed income funded from cash. The risk-reward trade-off between stocks and bonds looks relatively even to us, with core bonds providing a yield advantage over cash.
The STAAC recommends being neutral on style, favors developed international equities over emerging markets and large caps over small, and maintains the industrials sector as the top overall sector pick, with communication services and technology as top ideas based on technical analysis.
Within fixed income, the STAAC recommends an up-in-quality approach with a benchmark weight to duration. We think core bond sectors (U.S. Treasuries, Agency mortgage-backed securities (MBS), and short-maturity investment grade corporates) are currently more attractive than plus sectors (high-yield bonds and non-U.S. sectors) with the exception of preferred securities, which look attractive after having recently sold off due to the banking stresses.
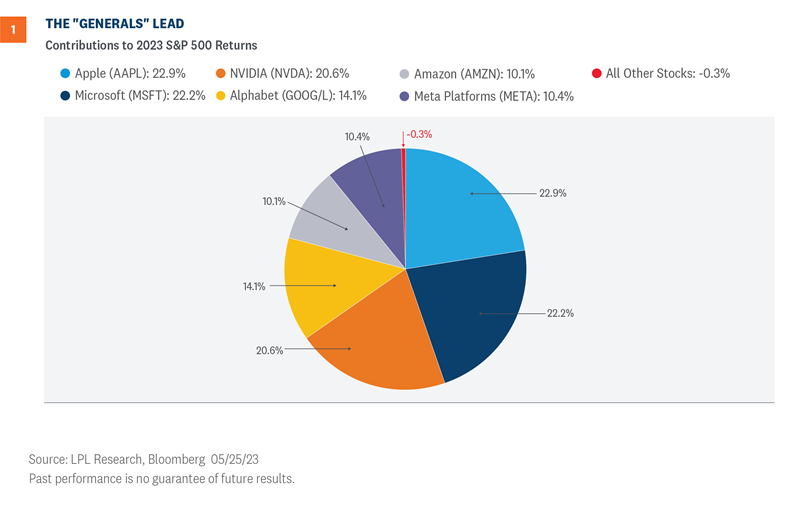
The mega-cap technology companies have powered the broad market higher this year. In fact, the 8.1% gain in the S&P 500 year to date has been driven entirely by six mega-cap stocks: Apple (AAPL), Microsoft (MSFT), NVIDIA (NVDA), Meta (META), Amazon (AMZN), and Alphabet (GOOG/L). Is this narrow leadership a problem for stocks looking forward? We try to answer that question below.
The Generals Lead
Mega-cap stocks, which have outlier market capitalizations and are often referred to as ‘the generals,’ have made an impressive comeback this year. Last year’s headwinds of higher rates underpinned by aggressive Federal Reserve (Fed) tightening have finally abated. Interest rate stabilization, signs of receding inflation, and a potential peak in the terminal rate by this summer have helped bring buyers back into the space. Rising recession odds in the U.S. have further increased the relative attractiveness of mega-caps, as investors have shown a growing propensity for higher quality, well-established companies with sustainable growth profiles and fortress balance sheets.
The rising popularity of artificial intelligence (AI) has been another major catalyst driving outperformance this year, as most of the generals are linked by varying degrees to the AI industry. Chipmaker NVIDIA (NVDA), a leader in AI who manufactures graphics processing units and other AI-related hardware and software, is up 160% year to date, including a 24% earnings-driven rally on May 25. As shown in Figure 1, the company has contributed nearly 21% to the S&P 500’s 8.1% year-to-date gain, despite the company representing only around a 2.7% index weight. Without NVDA or the rest of the generals (AAPL, MSFT, GOOG/L, AMZN, and META), the S&P 500 would be down 0.3% this year.
Bad Breadth
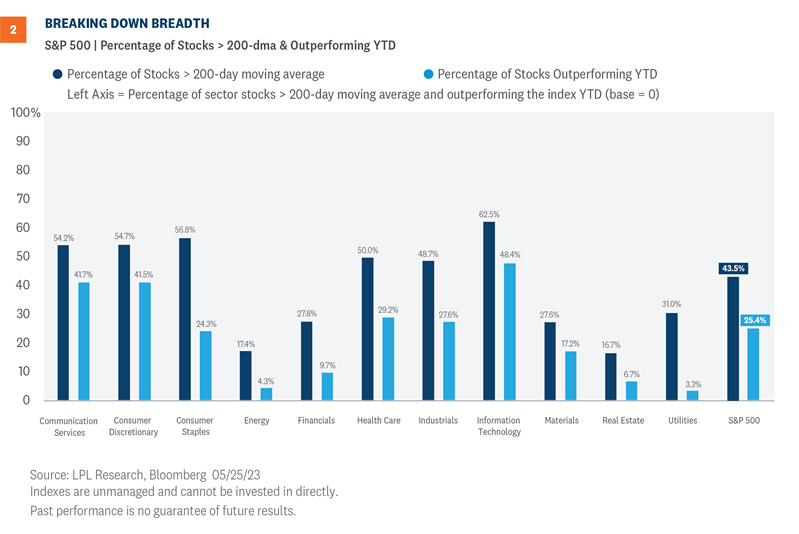
Narrow market leadership has been a major theme this year and is considered by many investors as a missing piece of the recovery puzzle. Less than half of the stocks comprising the S&P 500 are trading above their 200-day moving average (dma), while only around a quarter are outperforming the index year to date (Figure 2). Furthermore, these percentages have declined over the last several weeks, forming a bearish divergence between price and market breadth.
In a typical bull market or even a developing one, widespread participation provides confirmation of the uptrend’s strength and sustainability. When participation in the advance is limited—as is the case for 2023 thus far—vulnerabilities emerge as the weight of the market’s advance falls on the shoulders of a limited number of stocks. The lack of broad-based buying across equity markets also points to potentially limited investment opportunities and a lack of conviction among investors. Both of these attributes are likely impacting breadth this year as higher yields in the fixed income market raise the bar for capital crossing back over into equities.
While the fact that only six stocks are driving the S&P 500’s advance this year is concerning, taking a look underneath the hood shows a few sector bright spots that could keep the market moving forward along the road of recovery. Over half of the stocks within the communication services, consumer discretionary, and technology sectors are trading above their 200-dma, implying the majority of stocks within these sectors check the box for the basic definition of an uptrend. Furthermore, over 40% of the stocks in each sector are outperforming the S&P 500 this year. Collectively, these sectors represent around 46% of the S&P 500 and may provide enough support for the market to sustain its current uptrend.
What Does Bad Breadth Mean for Returns?
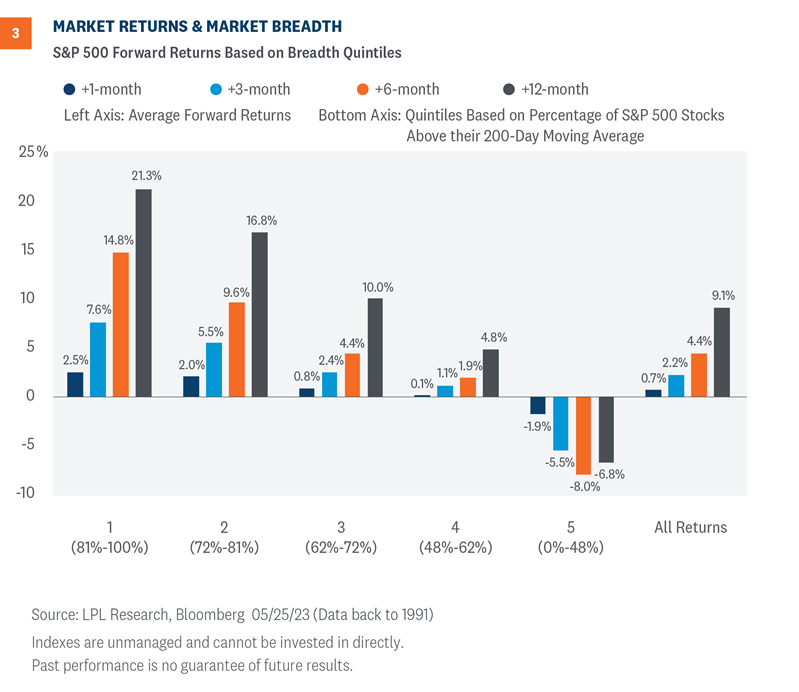
In order to help quantify the importance of market breadth, we broke down the percentage of S&P 500 stocks trading above their 200-dma into quintiles across a time series of data going back to 1991. The quintiles split the breadth readings of stocks above their 200-dma into five equal portions across the dataset. For example, the top, or first, quintile represents the highest 20% of breadth readings during this timeframe, while the fifth quintile represents the lowest 20% of breadth readings. After filtering the breadth percentages into quintiles, we then calculated forward returns for each trading day across the quintile groups.
As Figure 3 shows, market breadth has been a statistically strong indicator for future S&P 500 performance. The top quintile group, classified as periods when 81% or more of S&P 500 stocks were trading above their 200-dma, has notably outperformed the lower quintile groups along with the average S&P 500 returns across all periods during this timeframe. Unfortunately, the S&P 500 currently falls into the fifth quintile group as only 44% of constituents are above their 200-dma. Returns in this group have historically been negative over the following 12 months. This data further supports our thesis that broader participation will be required for the S&P 500 to have a sustainable breakout above key resistance at 4,200.
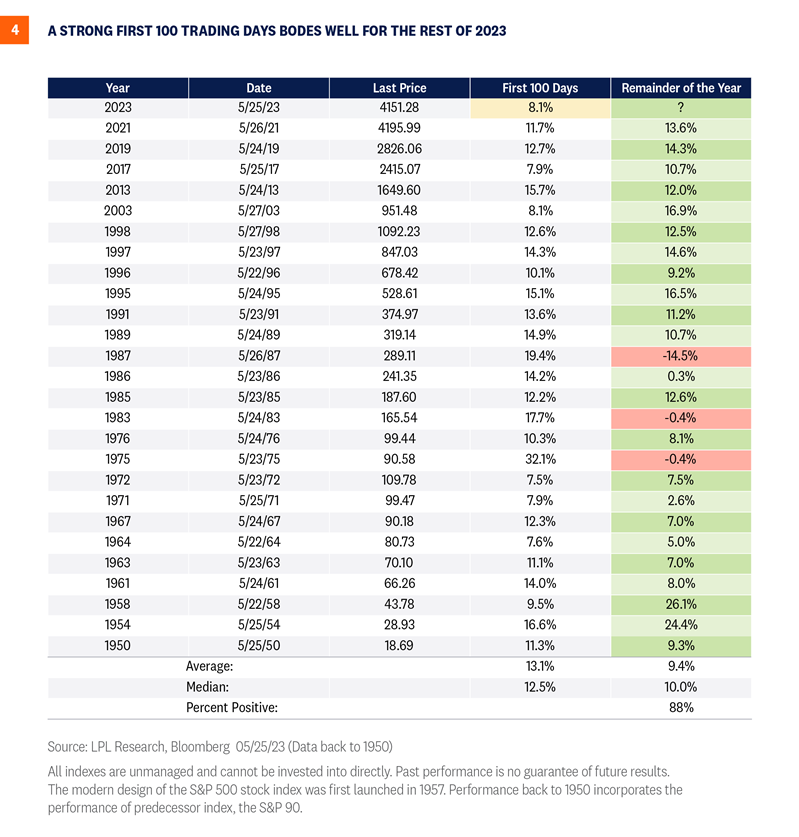
Strong Starts Often Followed by Solid Finishes: A Look at the First 100 Days
Bullish momentum and positive seasonality trends could help improve the narrow breadth backdrop. Thursday, May 25, was the 100th trading day of 2023, prompting us to ask what the market’s strong performance so far could mean for the rest of the year. Through that 100th trading day (about 40% of the way through the year), the S&P 500 gained a solid 8.1% (excluding dividends). If we look at similarly strong starts to years—we use 7% gains as the hurdle—the average gain the rest of the year has been quite strong at 9.4% (Figure 4). That compares to the average gain of 5.4% in all years from trading day #101 through year-end, on top of an average first 100-day performance in all years since 1950 of 3.4%.
The consistency of these strong finishes is also impressive. After these strong starts, the S&P 500 has added to those gains in 23 of 26 years (88%). As shown in Figure 4, two of the three years when stocks fell after the strong first 100 days ended only marginally lower—the S&P 500 fell just 0.4% the rest of the year in 1975 and 1983. That means only 1987 saw stocks experience a material decline after a strong start, which encompasses the Black Monday crash in October of that year. While we know there are no guarantees in this business, the consistency of this pattern over seven decades suggests it may very well hold up again.
Investment Outlook
There are a number of reasons to think stocks can end the year higher than where they are now. The tendency for stocks to build on gains after a strong first 100 days is one of them. Another, which NVIDIA highlighted last week, is that the earnings power of corporate America is greater than the market had previously anticipated, which could help support stocks in the weeks ahead, particularly if the timetable for a potential, likely mild, recession continues to get pushed out.
We still have risks of course. There’s the narrow market leadership highlighted in this commentary and the difficulty the S&P 500 has had breaking through the 4,200 resistance level. It looks like the debt ceiling debacle is almost behind us, though the additional resulting debt could put some upward pressure on short-term interest rates in the near term. Though regional bank stress appears contained for now, the commercial real estate challenges aren’t going away soon. And don’t break out your Fed pause champagne just yet because Friday’s still-stubbornly-high inflation data keeps a Fed rate hike next month on the table even if our odds still slightly favor a pause with some tough talk.
Latest Thoughts on Tactical Asset Allocation
The LPL Research Strategic and Tactical Asset Allocation Committee (STAAC) recommends a slight overweight allocation to equities, but with the risk-reward trade-off looking more neutral at this point, and higher interest rates offering more yield on the fixed income side, the Committee’s conviction on the equities overweight view has started to wane some.
The STAAC has squared up its views on growth and value, favors large caps over small, and maintains the industrials sector as the top overall sector pick, with communication services and technology as top ideas based on technical analysis.
Within fixed income, the STAAC recommends an up-in-quality approach with a benchmark weight to duration. We think core bond sectors (U.S. Treasuries, Agency mortgage-backed securities (MBS), and short-maturity investment grade corporates) are currently more attractive than plus sectors (high-yield bonds and non-U.S. sectors) with the exception of preferred securities, which look attractive after having recently sold off due to the banking stresses.
Adam Turnquist, CMT, Chief Technical Strategist, LPL Financial
https://www.rwmfinancialgroup.com/wp-content/uploads/2023/01/weekly-market-commentary-december-12.png450450R.W.M. Financial Grouphttps://www.rwmfinancialgroup.com/wp-content/uploads/2022/09/RWM_Brand-Identity_RGB_Wordmark_Color-1030x883.pngR.W.M. Financial Group2023-05-30 15:03:242023-05-30 15:03:27How Much of a Problem is Concentrated Leadership for Stocks?
Economists like to remind us there is no such thing as a free lunch. In investment parlance, that just means all investments carry risk—even cash. And the big risk with cash is reinvestment risk. That is, while short-term rates are currently elevated, the risk is these rates won’t last and upon maturity, investors will have to reinvest proceeds at lower rates. And if this current cycle follows history, we could see lower core bond yields over the next year, which would mean cash-only investors may miss out on these higher yields. LPL’s Strategic and Tactical Asset Allocation Committee (STAAC) recommends investors maintain a neutral duration relative to benchmarks with the expectation that Treasury yields are likely headed lower (or at least not much higher) over the next few quarters.
Balancing Short-Term Opportunities with Longer-Term Objectives
After the most aggressive rate hiking campaign in decades from the Federal Reserve (Fed), short-term interest rates are at levels last seen early in the 2000s. Moreover, due to the elevated fed funds rate and the subsequent carryover into the U.S. Treasury market, the Treasury yield curve is the most inverted since the early 1980s (that is shorter-term Treasury securities out yielding longer-maturity securities). This has (finally) allowed investors to generate a return on cash.
However, the Fed’s goal has been to take the fed funds rate into restrictive territory to make the cost of capital prohibitively expensive to slow aggregate demand, which should allow inflationary pressures to abate. Then what? Well, after winning its fight with inflation, markets expect the Fed to start cutting rates as early as this year. After keeping rates at these elevated levels, the Fed will then likely take the fed funds rate back to a more neutral level, which economists believe is 2.5%, or even lower. Just as the aggressive rate hiking cycle took Treasury yields higher, interest rate cuts will take Treasury (and other bond market) yields lower, and that is when the reinvestment risks will show up. And since inflationary pressures are easing, as cracks appear in the regional banking sector, it is likely the Fed is done with its rate hiking campaign, which could be welcome news for core bonds.
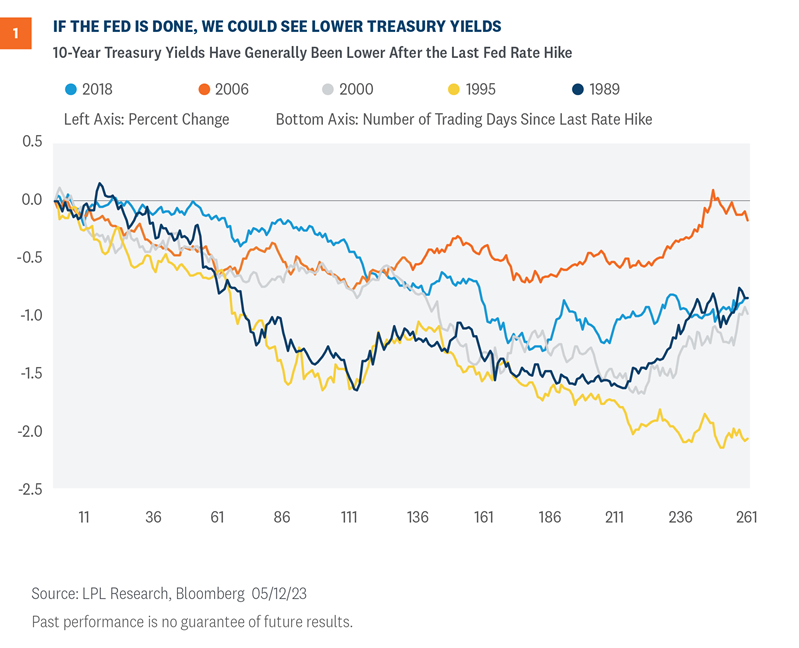
In fact, if the Fed is indeed done raising interest rates, we could start to see lower yields on intermediate-term securities before the Fed actually cuts rates. Of the most recent Fed rate hiking campaigns (Figure 1), 10-year Treasury yields were lower, on average, by 1% a year after the Fed stopped raising rates. And while our base case remains a trading range for the 10-year yield between 3.25% and 3.75% throughout 2023 (similar to the 2006 Fed rate hiking campaign, when the Fed kept rates at elevated levels for over a year), we acknowledge there is a strong bias for yields to end the year lower than our expectations, which could mean strong positive returns for core bonds.
Now, we also acknowledge there is a risk that inflationary pressures remain high and that the Fed has to continue its rate hiking campaign into a weakening economy. As we mentioned in our Outlook 2023:Finding Balance, in that stagflationary scenario where the Fed takes the fed funds rate to 6%, we could see the 10-year around 4.75%. However, given where starting yields are, if interest rates increase by another 1% from current levels, fixed income markets broadly could all still generate slightly positive returns over the next 12 months.
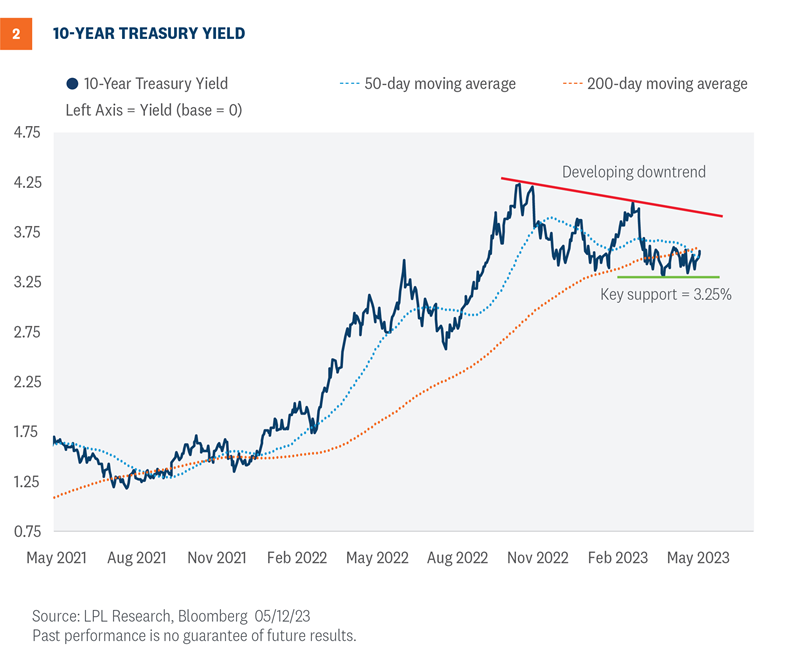
Technical Trends Suggest the Highs Are In
The technical setup for Treasuries suggest high watermarks for yields have likely been reached (Figure 2). Since core consumer inflation in the U.S. peaked last fall, 10-year yields have registered a string of lower highs that together form a developing downtrend. The recent bearish crossover of the 10-year yield’s 50-day moving average below the 200-day moving average adds to the evidence of a potential downtrend in the making. (For reference, moving averages represent the average yield across a select number of trading days and are used to identify trend direction.) The key word here is “potential,” as yields have not registered consecutive lower lows, a major piece of missing evidence to confirm a new downtrend is officially underway.
Despite several retests, support for the 10-year at 3.25% continues to hold. While this level is attributed to the recent April lows, it also traces back to the 2018 highs, a major breakout point for yields as they officially completed a multi-year bottom formation. Given the significance of the 3.25% support level and what we view as limited upside risk for yields based on both technical and macro factors, we suspect 10-year yields will remain range bound in the 3.25% to 3.75% range until a confirmed trend develops.
If History Rhymes…
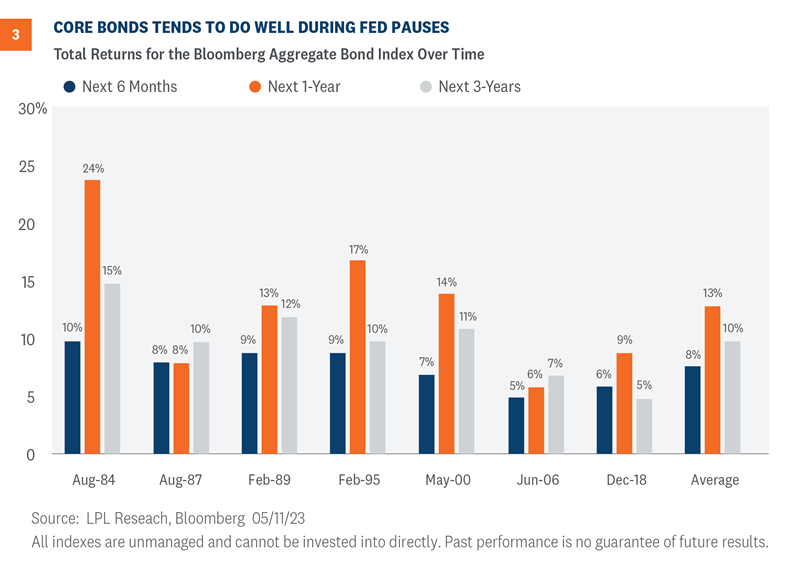
If history at least rhymes during this cycle and we do see lower yields over the next year, intermediate core bonds could very well outperform cash and other shorter maturity fixed income strategies. Historically, core bonds, as proxied by the Bloomberg Aggregate Bond Index, have performed well during Fed rate hike pauses (Figure 3). Since 1984, core bonds were able to generate average 6-month and 1-year returns of 8% and 13%, respectively, after the Fed stopped raising rates. Moreover, all periods generated positive returns over the 6-month, 1-year, and 3-year horizons.
Conclusion
Within our discretionary asset allocation models, we’ve maintained a neutral duration relative to our benchmark (the Bloomberg Aggregate Index) with the expectation that Treasury yields are likely headed lower (or at least not much higher) over the next few quarters. And if yields fall from current levels, investors will have likely missed an opportunity to invest in yields we’ve not seen in over a decade.
While we certainly think cash is a legitimate asset class again, it’s all about balancing today’s opportunity with what may or may not be available tomorrow. So, unless investors have short-term income needs, they may be better served by reducing some of their excess cash holdings and by extending the maturity profile of their fixed income portfolio to lock in these higher yields for longer. Bond funds and ETFs that track the Bloomberg Aggregate Index, along with separately managed accounts and laddered portfolios, all represent attractive options that will allow investors to take advantage of these higher rates before they’re gone.
Lawrence Gillum, CFA, Chief Fixed Income Strategist, LPL Financial
Adam Turnquist, CMT, Chief Technical Strategist, LPL Financial
https://www.rwmfinancialgroup.com/wp-content/uploads/2023/01/weekly-market-commentary-december-12.png450450R.W.M. Financial Grouphttps://www.rwmfinancialgroup.com/wp-content/uploads/2022/09/RWM_Brand-Identity_RGB_Wordmark_Color-1030x883.pngR.W.M. Financial Group2023-05-22 09:24:382023-05-22 09:24:40Will History Rhyme? A Fed Pause Has Been Good for Fixed Income
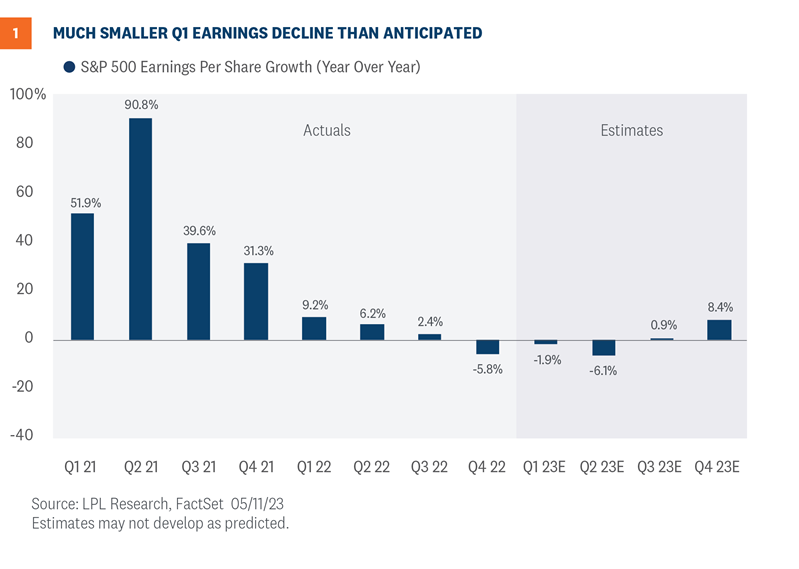
The first quarter earnings season is nearly complete, and it has caused us to regret titling our earnings preview commentary on April 10, “Malaise Continues.” While the “better than feared” label fit the past couple of earnings seasons quite well, based on the magnitude of upside surprises in the first quarter, and encouraging guidance from corporate America, that’s probably underselling it. There’s plenty to worry about the rest of the year (debt limit, recession, tightening financial conditions, a Federal Reserve (Fed) policy mistake, among them), but the risk of an additional sharp contraction in profit margins has come way down.
Big Upside Surprise
Corporate America faced several headwinds during the first quarter, including, most notably, lackluster economic growth, still-high inflation, and related cost pressures, and stress in the banking system that caused financial conditions to tighten after the bank failures in March. Plus, S&P 500 companies were coming off a difficult fourth quarter in which earnings fell short of estimates. These factors led analysts to forecast a 6-7% year-over-year earnings decline in the first quarter, slightly worse than the roughly 5% decline in the fourth quarter of 2022. What we’ve gotten has been much better than that (Figure 1).
So what helped drive such a big upside surprise? We would point to these five factors:
Economic growth hung in there. First-quarter growth in gross domestic product (GDP) wasn’t great by any means, but it was positive at 1.1% annualized on an inflation-adjusted (real) basis. Perhaps more importantly, corporate management teams have been preparing for a recession for some time, so guidance at the start of the year was perhaps more conservative than it needed to be. China’s reopening provided a small tailwind, while Europe has held up relatively well.
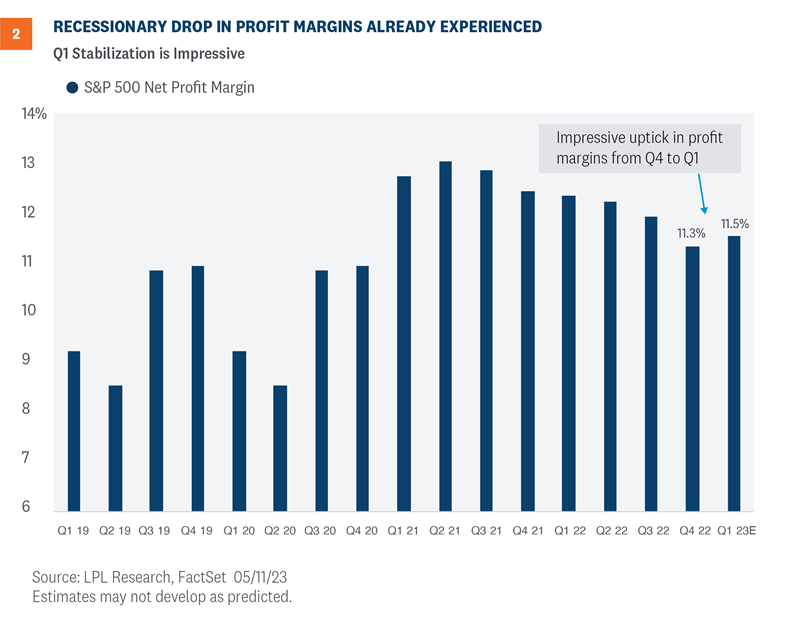
Efficiency. Cost controls started to get some attention from the big tech companies in the fourth quarter, particularly for Meta/Facebook (META), but were adopted more broadly during the first quarter, propping up margins that were unexpectedly higher quarter over quarter (Figure 2). The average amount of margin compression in a mild recession has historically been less than 2 percentage points, already experienced by S&P 500 companies.
Big revenue surprise. Analysts and strategists seem to have forgotten that inflation boosts revenue. Revenue rose 4% in the first quarter of 2023 compared with forecasts below 2% prior to reporting season. Higher prices mean more revenue for someone. Given consumers came into this weak earnings period flush with cash, those prices are being absorbed better than many had anticipated. Nominal GDP, or GDP including inflation, rather than inflation-adjusted, or real GDP, rose 7% year over year and tends to correlate well with revenue over time.
Greenback pullback. While the U.S. dollar was up year over year in the first quarter of 2023 compared with 2022, it has fallen slightly year to date. Management guidance earlier this year may have baked in more conservative currency assumptions. A lower dollar props up international earnings for U.S. multinational companies (approximately 40% of total S&P 500 company earnings).
Tighter credit didn’t matter much. S&P 500 companies, still with fortified balance sheets, don’t rely much on banks for credit. So while tight credit will continue to put pressure on smaller companies, the big companies that drive S&P 500 profits are perhaps more insulated than markets had assumed. Also note, the big S&P 500 banks have been beneficiaries of the stress in the banking system, gaining deposits from smaller banks.
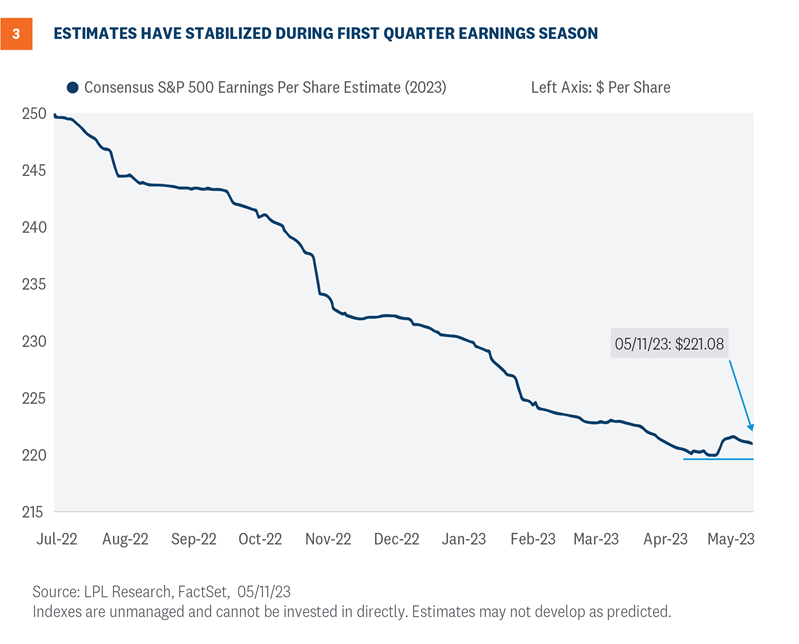
These positive surprises contributed to an increase in the consensus 2023 earnings estimate during earnings season, offering a sign of stability that should cause some of the earnings bears—and there are many—to rein in some of their pessimism (Figure 3).
Trimming 2023 Earnings Estimates on Increased Recession Risk
In a typical year, a solid earnings season relative to expectations would not trigger a reduction in earnings estimates. But this year is anything but typical. As the odds of recession have increased, the chances of a late-year earnings rebound have diminished. In other words, as we’ve signaled in recent commentaries, our estimate of flat earnings per share (EPS) for the S&P 500 in 2023 at around $220 looks a bit high.
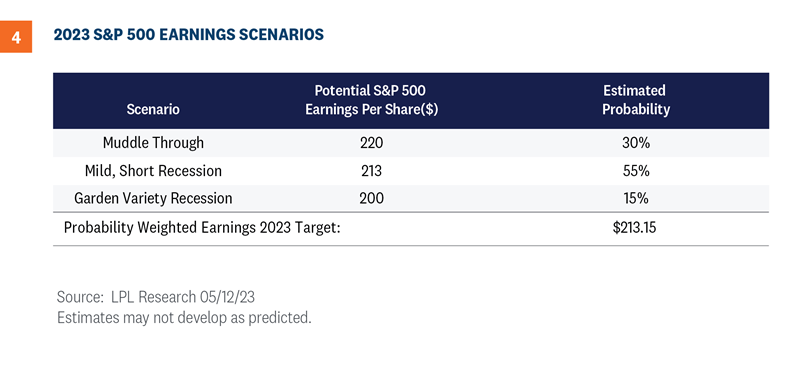
We use the following scenarios to come up with an updated, probability weighted earnings forecast for 2023:
In a muddle through economic scenario, we would expect S&P 500 earnings to hold up fairly well and potentially hit current consensus estimates around $220.
In a mild, short-lived recession beginning later this year, perhaps the $212 to $214 range is a reasonable forecast.
In a typical recession, we would expect something closer to $200 per share in 2023 EPS, or about a 10% year-over-year decline.
If we probability weight these, as shown in Figure 4, with a mild recession the highest probability, we end up with an S&P 500 earnings number in the $212–$214 range for 2023.
An Early Look at 2024
For 2024, given the likelihood that a late-2023 recession spills over into early next year, we’re taking our forecast for S&P 500 EPS down from $240 to $230, still an 8% increase from our downwardly revised 2023 estimate and consistent with the long-term average earnings growth rate for the index.
We make no change to our year-end S&P 500 fair value target range of 4,300–4,400, with the index currently just 4% below the low end of the range. Lower interest rates support higher stock valuations, so a price-to-earnings ratio (P/E) near 19 on $230 in S&P 500 EPS in 2024 looks reasonable. Recall the 10-year Treasury yield, near 3.40%, was about 0.6% higher in early March before Silicon Valley Bank failed.
At year end, we expect the inflation outlook to look much better, enabling market participants to look through the economic malaise and toward recovery in 2024—hopefully with the debt ceiling and regional bank issues fully put to rest.
Investment Outlook
Solid earnings results compared with expectations have helped keep stocks afloat in recent weeks amid debt ceiling jitters, regional bank concerns, and louder calls for recession. But we’re still in an earnings lull and a weak seasonal period for stocks. While a Fed pause is likely to arrive in June, gains may depend on the continued resilience of the U.S. economy. And the S&P 500 has had a very tough time breaking through the 4,200 chart resistance level, so we may be in for more choppiness from a technical perspective. Bottom line, while stocks may beat bonds over the rest of the year, we do not see a lot of upside.
The LPL Research Strategic and Tactical Asset Allocation Committee (STAAC) recommends a slight overweight allocation to equities, with a move back down to neutral in the near term currently under discussion. The STAAC has squared up its views on growth and value, favors large caps over small, and maintains the industrials sector as the top overall sector pick. From a pure technical analysis perspective, communication services and technology look increasingly constructive with building relative strength.
Within fixed income, the STAAC recommends an up-in-quality approach with a benchmark weight to duration. We think core bond sectors (U.S. Treasuries, Agency mortgage-backed securities (MBS), and short-maturity investment grade corporates) are currently more attractive than plus sectors (high-yield bonds and non-U.S. sectors) with the exception of preferred securities, which look attractive after having recently sold off due to the banking stresses.
Jeffrey Buchbinder, CFA, Chief Equity Strategist
https://www.rwmfinancialgroup.com/wp-content/uploads/2023/01/weekly-market-commentary-december-12.png450450R.W.M. Financial Grouphttps://www.rwmfinancialgroup.com/wp-content/uploads/2022/09/RWM_Brand-Identity_RGB_Wordmark_Color-1030x883.pngR.W.M. Financial Group2023-05-15 09:44:482023-05-15 09:44:50Earnings Update: Better than Feared Undersells These Results
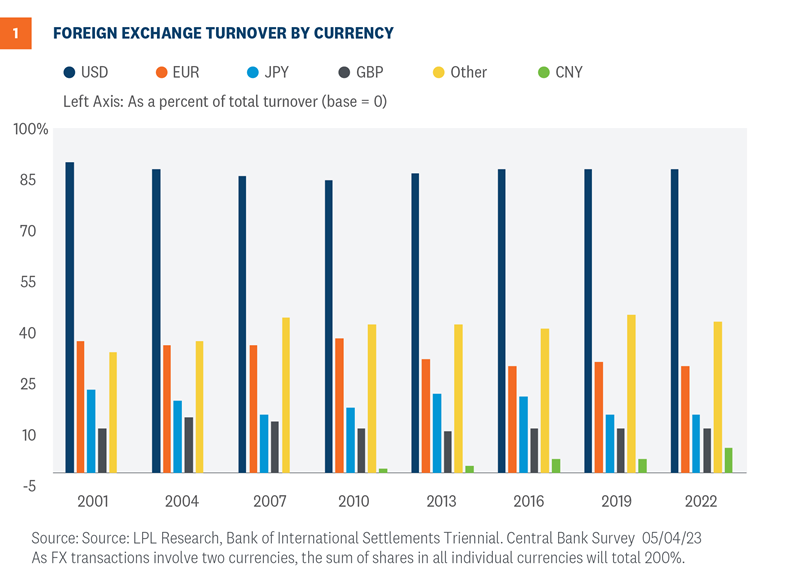
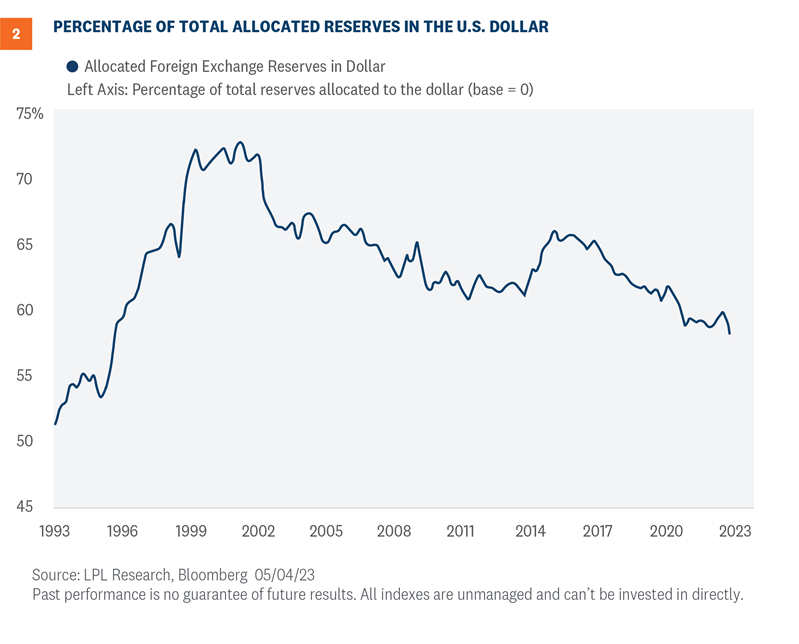
Much has been written lately about the threats facing the reserve currency status enjoyed by the U.S. dollar. “De-dollarization” headlines appear on a near-daily basis, suggesting the dollar’s reign is in looming jeopardy, while counterarguments point out there isn’t another currency with the depth, transparency, and reliability associated with the dollar. Still, critics accuse the U.S. of having “weaponized” the dollar, that is, punishing other countries with sanctions and freezing assets. These accusations have been particularly prevalent as the Ukraine/Russia conflict continues, with Russia and its long-standing allies asserting that the U.S. has illegally frozen billions of dollars of Russian financial assets.
In addition, China has been increasingly active on the world stage as it seeks to elevate the yuan as a reserve currency and dent the hegemony of the dollar’s rule in global trade and overall standing.
Affecting the dollar currently, in economic terms, is that the Federal Reserve (Fed) is near, or at the end of its aggressive rate hike campaign that began in March 2022, and accordingly, the dollar has been edging lower against the basket of currencies of its largest trading partners. As a result, the dollar has been losing the “interest rate differential” that propelled the dollar to an almost parabolic high for much of 2022, while the euro has gained strength as the European Central Bank (ECB) continues to raise interest rates.
The Dollar Within the Global Framework
The dollar, thanks in large part to its liquidity and reliability, is used as the primary currency of choice by the majority of global central banks that keep a good portion of their reserves in dollars. To be sure, central banks have been heavy purchasers of gold as concerns build over the ramifications of de-globalization and what has been viewed as “fragmentation” as new trading blocs are discussed and being formed.
Foreign companies still borrow in dollars and use the dollar in their normal trading operations, with the dollar the leading currency in global trade invoicing and settlements.
Part of the criticism leveled at the U.S. is that the ubiquitous use of the dollar has allowed the U.S. to run an unfairly large trade deficit, at the expense of trading partners. While the U.S trade deficit was $64.2 billion in March, and is the largest trade deficit globally, the United Kingdom, Mexico, and Brazil also run large deficits.
China Stages a Push to Legitimize the Yuan Towards Reserve Status
Of all of the reporting regarding threats against the dollar’s dominance within the global financial infrastructure, China’s drive towards increasing acceptance of the yuan as a reserve currency carries the most relevancy. As the world’s second-largest economy, it has for many decades had important trade relationships priced in the yuan, or renminbi, the official name for its currency.
Many companies have been using the yuan for decades, as trade with China is an integral part of their global market footprint.
In 2016, the International Monetary Fund (IMF) added the renminbi to its Special Drawing Rights (SDR) basket following years of intense lobbying by China. Established in 1969, the IMF considers the SDR as a “supplementary international reserve asset”. The SDR now includes the U.S. dollar, the euro, the British pound sterling, the Japanese yen, and the Chinese renminbi.
The debate over China’s entry into the SDR centered on its status as an emerging market and concerns over its human rights record. Still, the IMF board voted to allow the renminbi to join the group of developed market currencies, affording its currency a legitimacy of sorts.
China’s President Xi Jinping has been behind an intense effort to secure trade agreements globally, and the results have been successful in terms of global reach, including Russia and Saudi Arabia. Within Europe, China has a long-established relationship with Italy and is carving out deeper bilateral ties with France. Brazil has also been an active trading partner with China. Russia strengthened its relationship with China when it was banned from using SWIFT, the global financial transaction processing system.
But the outreach is also tinged with an anti-U.S. posture, as tensions between the U.S. and China escalate on many fronts, particularly over Taiwan. The “weaponized dollar” theme has been playing well as China’s stepped-up bilateral efforts gain momentum.
Chinese officials point to the sanctions imposed on Russia as an example of how the U.S. has weaponized the dollar, which certainly extrapolates easily to what a U.S.-led effort could do against Chinese assets in the event of a forced takeover of Taiwan. It’s been evident that China has been transitioning away from the dollar as the People’s Bank of China has been a major buyer of gold as it increases its stockpiles. It is estimated the central bank now has 2,068 tons in its gold reserve.
King Dollar Still Reigns
The euro has, since its inception in 1999, become an important global reserve currency in terms of its use in global trade, however, because of its fragmented political and economic structure, its rise towards a more complete reserve status is thwarted. That the yuan is rising in its acceptance by trading partners is apparent, but to be recognized as an authentic reserve currency requires transparency, reliability, and credibility.
The dollar’s backing is exemplified by a sound foundation, a history of credibility, and transparency that cannot be negated by its detractors. King dollar still reigns and will for the foreseeable future.
Investment Outlook
LPL Research remains comfortable with its year-end S&P 500 fair value target of 4,300–4,400, based on a price-to-earnings ratio of 18 and $240 in S&P 500 earnings per share in 2024. But as stocks get closer to that target, LPL Research’s Strategic and Tactical Asset Allocation Committee (STAAC) may reconsider its recommended slight overweight allocation to equities. The year-end forecast range for the 10-year Treasury yield remains 3.25% to 3.75%.
The Committee notes that the outlook for growth stocks has improved, suggesting balanced style exposure, while the outlook for small caps has become more challenging in recent weeks, as credit conditions have tightened amid ongoing small bank stress, supporting an overweight large cap stance. The STAAC has upgraded its view of international equities to overweight on attractive valuations and improved technical analysis trends, while the potential for U.S. dollar weakness in the intermediate term is a potential catalyst. Industrials remain the Committee’s top sector pick.
Within fixed income, the Committee recommends an up-in-quality approach with a benchmark weight to duration. We think core bond sectors (U.S. Treasuries, Agency mortgage-backed securities (MBS), and short-maturity investment grade corporates) are currently more attractive than plus sectors (high-yield bonds and non-U.S. sectors) with the exception of preferred securities, which look attractive after having recently sold off due to the banking stresses.
Quincy Krosby, PhD, Chief Global Strategist
https://www.rwmfinancialgroup.com/wp-content/uploads/2023/01/weekly-market-commentary-december-12.png450450R.W.M. Financial Grouphttps://www.rwmfinancialgroup.com/wp-content/uploads/2022/09/RWM_Brand-Identity_RGB_Wordmark_Color-1030x883.pngR.W.M. Financial Group2023-05-08 09:27:432023-05-08 09:27:45King Dollar Still Rules: Why It Continues to Reign
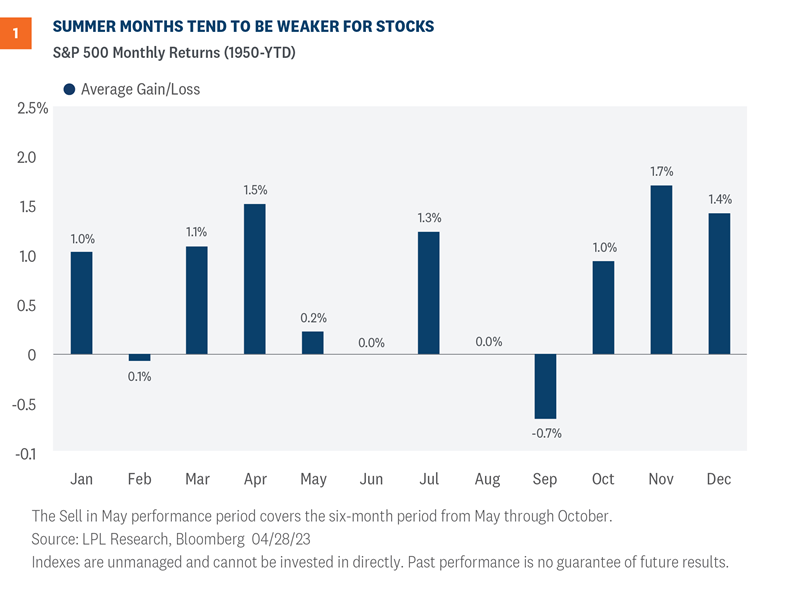
“Sell in May and go away” is probably the most widely cited stock market cliché in history. Every year a barrage of Wall Street commentaries and stories in the financial press floods in about this popular, but overused, stock market adage. Here we take our annual look at this historical seasonal pattern which, as you will see below, has started to lose some of its street creds recently.
What is sell in may?
“Sell in May and go away” is the seasonal stock market pattern in which stocks generally produce the best returns from November through April and the worst returns from May through October. This pattern has been strong enough—and the adage popular enough—that it has probably been somewhat of a self-fulfilling prophecy over many years. Some investors do think it’s best to either avoid or reduce equities during this period. We’re not so sure.
The two figures below illustrate this pattern. Figure 1 shows average returns by calendar month (data back to 1950). Here you can see stocks tend not to do as well during middle months, on average, particularly May through September.
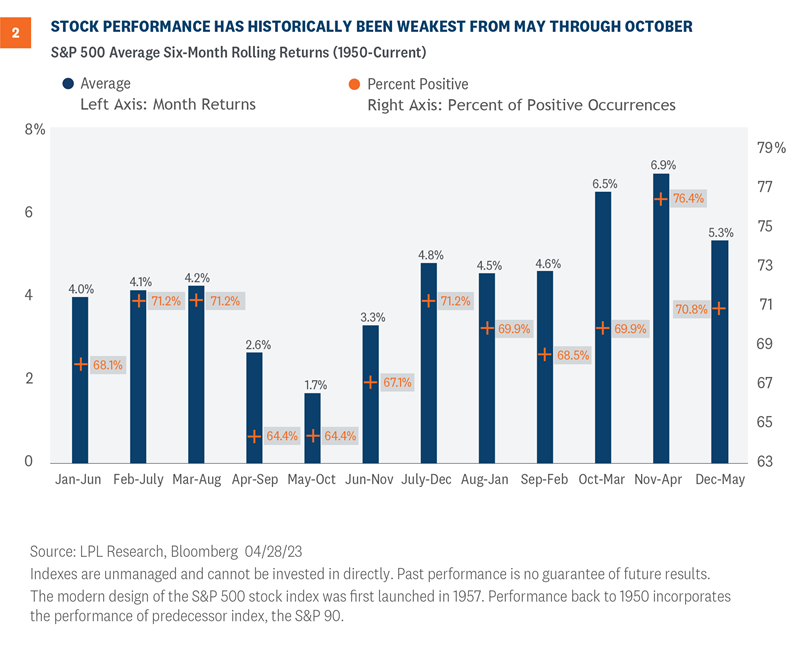
Figure 2 illustrates rolling six-month returns for each of the 12 rolling six-month periods by month (again, data back to 1950). Here you see the weakest six-month period for stocks historically, on average, has been May through October (1.7%), while the best six-month period has come between November and April (6.9%).
Interestingly, the S&P 500 was up 7.6% over the past six months (November through April), roughly in line with the historical average. That may suggest a typical gain for the next six months might be in order. That’s not great, but it’s not terrible. We think we can make a good case for an upside beyond that 1.7% between now and Halloween. And that would still leave the seasonally strong November and December months for the S&P 500 Index to reach our year-end fair value target range of 4,300–4,400.
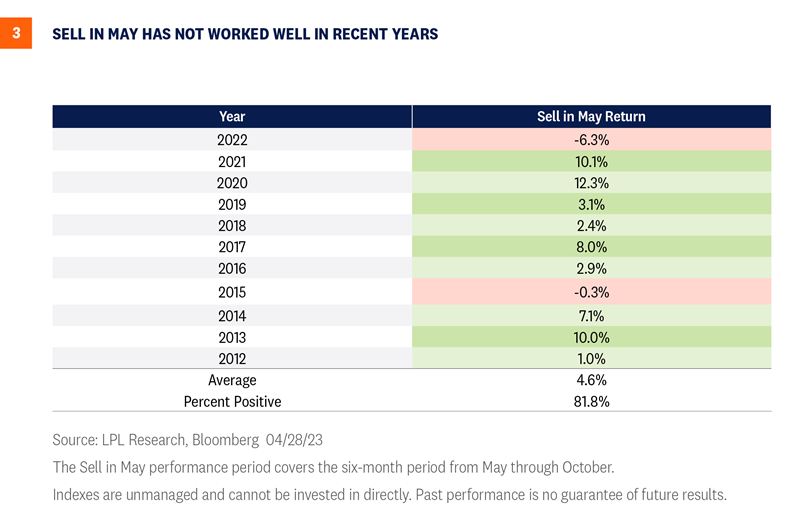
In recent years, buy-in may has worked better
We should also keep in mind, as we head into this seasonally weak period, that the S&P 500 has closed higher during the month of May nine out of the past 10 years—so maybe the pattern should be “Sell in June.” Also, consider that this seasonally weak period has actually been quite strong in recent years. In fact, stocks gained during this seasonally weak six-month period in nine of the past 11 years, as you can see Figure 3.
So what about this year?
Our year-end fair value target for the S&P 500 implies about a 4% upside over the balance of 2023, That target is based on a price-to-earnings ratio (P/E) of 18 and our 2024 earnings forecast of $240 (though that estimate is under review, and the Strategic and Tactical Asset Allocation Committee’s (STAAC) bias is to potentially bring that estimate down some). The “right answer” to potentially get us there may actually be a higher P/E and lower earnings, though we’ve been encouraged by first-quarter earnings results thus far (more on that topic here in the coming weeks).
Assuming stocks generate another 4–5% upside between now and year-end, the question is when do those gains come? Gains late in the year would make sense because of this seasonal pattern and opportunities to 1) gain more clarity on the path of the economy and 2) make progress bringing inflation down to help get the Federal Reserve (Fed) off the market’s back.
On the other hand, market sentiment and traders’ positioning are pessimistic enough that maybe just bringing the Fed’s rate hiking campaign to an end this spring, getting past the debt limit increase, and seeing earnings avoid a collapse (which we’re clearly seeing during the current earnings season) could be enough to push this market higher. Finally, if the “Sell in May” pattern hasn’t worked well in recent years, maybe it won’t in 2023.
Our guess is more gains come later in the year, and that we see a 5–10% pullback between now and Halloween as is typical (we get three of those a year, on average), but that is not a high conviction prediction.
Investment Outlook
As stocks enter a seasonally weak period with near-term macro risks ahead, investors may not want to stray too far from their benchmark exposures to equities. Stocks are getting more support from earnings than we had anticipated, but earnings declines aren’t over. While the May rate hike from the Fed may be its last of this cycle—we’ll learn more about that when we hear from Fed Chair Jerome Powell and company on Wednesday—clearly the inflation problem hasn’t yet been solved.
Bottom line, LPL Research remains comfortable with its year-end S&P 500 fair value target of 4,300–4,400. But as stocks get closer to that target, LPL Research’s Strategic and Tactical Asset Allocation Committee (STAAC) may reconsider its recommended slight overweight allocation to equities. The Committee notes that the outlook for growth stocks has improved, suggesting balanced style exposure, while the outlook for small caps has gotten more challenging in recent weeks, as credit conditions have tightened amid ongoing small bank stress. The industrials sector remains the Committee’s top pick.
Within fixed income, the Committee recommends an up-in-quality approach with a benchmark weight to duration. We think core bond sectors (U.S. Treasuries, Agency mortgage-backed securities, (MBS) and short-maturity investment grade corporates) are currently more attractive than plus sectors (high-yield bonds and non-U.S. sectors) with the exception of preferred securities, which look attractive after having recently sold off due to the banking stresses.
Jeffrey Buchbinder, CFA, Chief Equity Strategist
Adam Turnquist, CMT, Chief Technical Strategist
https://www.rwmfinancialgroup.com/wp-content/uploads/2023/01/weekly-market-commentary-december-12.png450450R.W.M. Financial Grouphttps://www.rwmfinancialgroup.com/wp-content/uploads/2022/09/RWM_Brand-Identity_RGB_Wordmark_Color-1030x883.pngR.W.M. Financial Group2023-05-01 10:00:332023-05-01 10:00:37Sell in May: Does This Stock Market Adage Come into Play
We may request cookies to be set on your device. We use cookies to let us know when you visit our websites, how you interact with us, to enrich your user experience, and to customize your relationship with our website.
Click on the different category headings to find out more. You can also change some of your preferences. Note that blocking some types of cookies may impact your experience on our websites and the services we are able to offer.
Essential Website Cookies
These cookies are strictly necessary to provide you with services available through our website and to use some of its features.
Because these cookies are strictly necessary to deliver the website, refusing them will have impact how our site functions. You always can block or delete cookies by changing your browser settings and force blocking all cookies on this website. But this will always prompt you to accept/refuse cookies when revisiting our site.
We fully respect if you want to refuse cookies but to avoid asking you again and again kindly allow us to store a cookie for that. You are free to opt out any time or opt in for other cookies to get a better experience. If you refuse cookies we will remove all set cookies in our domain.
We provide you with a list of stored cookies on your computer in our domain so you can check what we stored. Due to security reasons we are not able to show or modify cookies from other domains. You can check these in your browser security settings.
Google Analytics Cookies
These cookies collect information that is used either in aggregate form to help us understand how our website is being used or how effective our marketing campaigns are, or to help us customize our website and application for you in order to enhance your experience.
If you do not want that we track your visit to our site you can disable tracking in your browser here:
Other external services
We also use different external services like Google Webfonts, Google Maps, and external Video providers. Since these providers may collect personal data like your IP address we allow you to block them here. Please be aware that this might heavily reduce the functionality and appearance of our site. Changes will take effect once you reload the page.
Google Webfont Settings:
Google Map Settings:
Google reCaptcha Settings:
Vimeo and Youtube video embeds:
Other cookies
The following cookies are also needed - You can choose if you want to allow them:
Privacy Policy
You can read about our cookies and privacy settings in detail on our Privacy Policy Page.