Investors use various analogies to describe the importance of small businesses in the domestic economy. Some refer to the small business sector as the backbone or the lifeblood of the economy. At this current stage of the cycle, we could say there are rising risks of an acute backache or a draining of that lifeblood. In this edition of the Weekly Market Commentary, we discuss the weakness in small businesses and what that foreshadows in the markets and the economy.
Overview
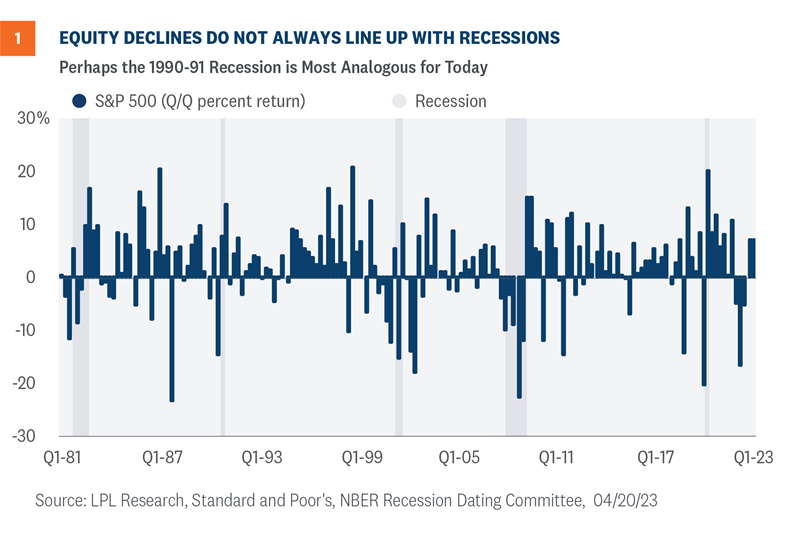
As we progress through 2023, investors have at least two corresponding questions: when will a recession start and will the markets retest their lows? If we are to develop a cogent answer, we must remember the relationship between equity markets and recessions is not always consistent.
In some periods, quarterly equity returns hit near-term lows during recessions, but not for the early 1990s, as shown in Figure 1. In fact, the S&P 500 fell over 14% quarter over quarter in the third quarter of 1990 as the business cycle reached a peak. And in the following two quarters during the recession, the S&P 500 rose roughly 8% and 14%—more than enough to recover losses incurred earlier in 1990.
Short and Shallow
Our base case is the U.S. economy will likely hit a short and shallow recession sometime late this year, with a potential of that negative shock pushed out into the beginning of next year. Current indicators suggest the recession will come sooner rather than later. The Conference Board’s March Leading Economic Indicators (LEI) fell to levels last seen in November 2020 when the economy was reeling from a global pandemic. Markets shrugged off the decline in the March index since investors already knew the weakness in the 10 underlying components. Historically, an economic contraction has closely followed a decline in the LEI of this magnitude. A recession may be all but certain, so the more important question is if markets will hit new lows as the economy contracts. We think not.
The head fake from last year’s two quarters of negative economic growth and the uncertainty from an aggressive Fed were primary culprits for pushing down the markets last year. Although 2023 has its fair share of risks, we do not think markets will retest last year’s lows, despite the likelihood of a recession later this year. Perhaps the relationship between the equity markets and the 1990-91 recession is most informative for today’s most likely scenario.
Watch Small Businesses for Leading Indicators
Small businesses are often considered the backbone of the economy because of the amount of economic activity generated by the sector, and it looks like a backache has emerged. Pay careful attention to surveys from the National Federation of Independent Businesses (NFIB) for leading insights in the direction of the U.S. economy.
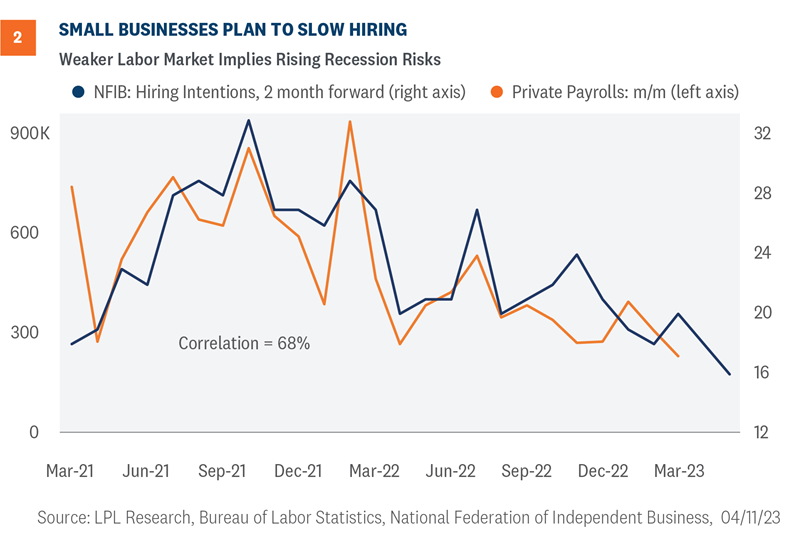
As shown in Figure 2, hiring intentions among small businesses declined in March, implying that upcoming job reports will likely be lackluster. Small businesses have an incredible impact on both the national and local economy. Small businesses make up the majority of all businesses by count, while also employing over 46% of the private sector workforce.1 It’s not a stretch to say “as goes the small and independent business, so goes the national economy.”
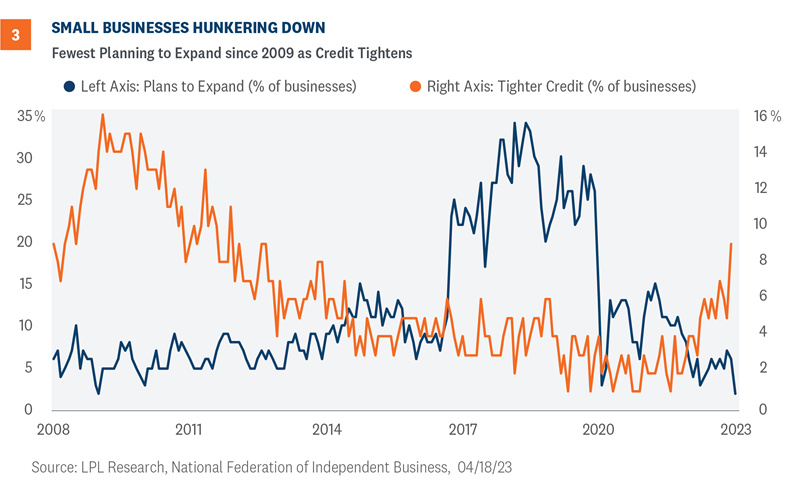
We know small businesses are especially concerned about a potential credit crunch. As shown in Figure 3, firms are hunkering down as few have expansionary plans in the near future. In fact, the number of firms reporting any expansion plans is the lowest since early 2009 when the economy was in the depths of the Great Financial Crisis. No doubt, tighter credit conditions impacted those decisions. The percent of small businesses reporting tighter credit is the highest since 2012, as lending institutions tighten up under the uncertainty of the macro landscape and following mid-March banking turmoil.
Summary and Investment Outlook
Businesses appeared to hunker down under the weight of tighter credit conditions and weaker economic growth. If small businesses are an accurate barometer, recession risks are rising and the labor market will likely cool in the coming months. Although the economy is slowing, the Fed continues its fight with inflation and will likely hike rates at the next meeting on May 2-3. However, if the economy becomes more unstable, inflation continues to decelerate, and the job market loosens, the Fed could pivot to rate cuts by the end of the year.
LPL Research remains comfortable with its year-end S&P 500 fair value target of 4,300–4,400. While that target was set based on a price-to-earnings ratio (P/E) of 18 and a 2024 EPS estimate of $240, the P/E may be a bit higher and the earnings number a bit lower when all the results are in. That said, the start of first quarter earnings season has been encouraging.
The LPL Research Strategic and Tactical Asset Allocation Committee (STAAC) recommends a modest overweight allocation to equities, with a slight preference for value over growth. Consistent with increasingly cautious signals from small businesses, the Committee has reduced its small cap allocation to benchmark levels. The Committee’s top sector pick remains industrials.
Within fixed income, the Committee recommends an up-in-quality approach with a benchmark weight to duration. We think core bond sectors (U.S. Treasuries, Agency mortgage-backed securities (MBS), and short-maturity investment grade corporates) are currently more attractive than plus sectors (high-yield bonds and non-U.S. sectors) with the exception of preferred securities, which look attractive after having recently sold off due to the banking stresses.
Jeffrey Roach, PhD, Chief Economist
Jeffrey Buchbinder, CFA, Chief Equity Strategist
https://www.rwmfinancialgroup.com/wp-content/uploads/2023/01/weekly-market-commentary-december-12.png450450R.W.M. Financial Grouphttps://www.rwmfinancialgroup.com/wp-content/uploads/2022/09/RWM_Brand-Identity_RGB_Wordmark_Color-1030x883.pngR.W.M. Financial Group2023-04-24 09:13:452023-04-24 09:13:46Draining the Lifeblood of the Economy: The Small Business Sector
The commercial real estate (CRE) market has recently captured the spotlight after being flagged as the next potential shoe to drop following last month’s banking turmoil. While rising rates have weighed on financing costs and the recent bank failures will make lending more restrictive, the post-pandemic world has produced structural changes that will likely weigh on the sector, especially within the retail and office segments. Banks, especially smaller cap regionals, are most exposed to CRE if credit cracks continue to widen.
Background
The troubles brewing in the CRE market have percolated since the pandemic—especially for the office and retail segments. Lockdowns and closures of most major cities brought both work and shopping into the homes of most Americans.
As the services sector shut down, consumers opted to shop online for goods. The shift in spending habits ultimately reduced the need for brick-and-mortar stores during an unfortunate period when many businesses closed their doors. As we all learned in economics, reduced demand and increased supply lowers the price equilibrium for the retail CRE sector.
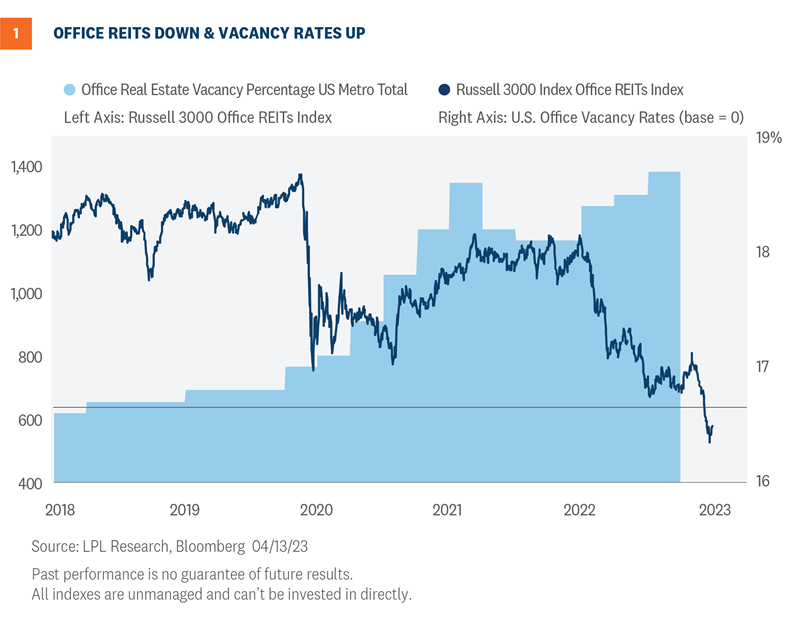
The office sector of CRE is facing a similar supply and demand imbalance. With what many believed was a temporary solution to office closures, work-from-home policies have continued since the pandemic as employees now opt for remote work by choice rather than necessity. This structural shift has reduced demand for office space and pushed vacancy rates to record highs at the end of 2022 (Figure 1, shaded area).
The Russell 3000 Office REIT Index shown in Figure 1, comprised of companies owning, operating, developing, or leasing office buildings, is down around 60% from its pre-pandemic highs. Nearly half of those losses came during the banking turmoil last month, pushing the index back down to record lows.
While the market has clearly priced in a lot of negativity for office REITs, the upward trajectory of vacancy rates implies there could be more downside risk ahead. Furthermore, higher frequency data shows there is still a long way to go for office occupancy rates to normalize back to pre-pandemic levels—an unlikely event given the proliferation of work from home policies across corporate America.
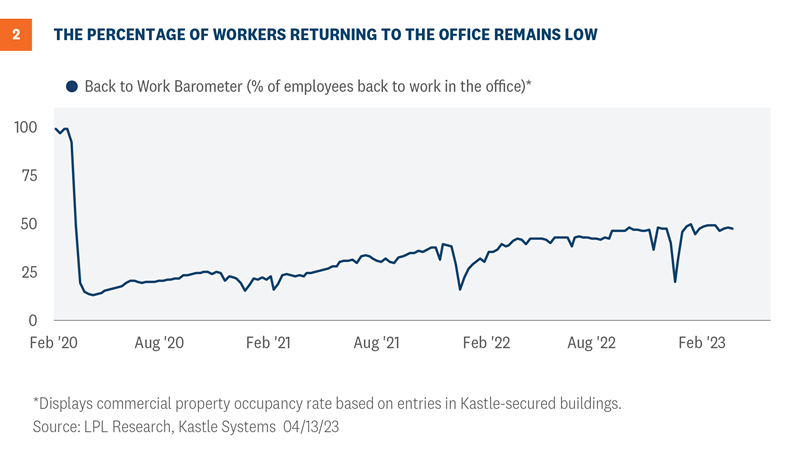
The Back to Work Barometer shown in Figure 2 shows the weekly occupancy rate based on data from Kastle Access Control Systems. The data includes app, keycard, and fob usage for 2,600 buildings and 41,000 businesses across 47 states. While the trend of employees returning back to the physical office is improving, the percentage remains well below pre-pandemic levels.
Where is the risk
Credit and liquidity are the primary risks impacting the CRE market right now. While ownership of CRE debt is relatively diverse, banks hold 61% of all CRE mortgages, according to FactSet. Credit spreads within investment-grade commercial mortgage-backed securities, which rise in conjunction with default risk, have roughly doubled over the last 12 months. Elevated credit risk, constrained lending due to the fallout from the recent banking turmoil, and declining commercial property values have exacerbated both credit and liquidity concerns for the CRE market. This backdrop will negatively impact refinancing costs as CRE debt comes due. For office REITs, there is an estimated $12.5 billion in total debt maturing in 2023 and 2024 with an average coupon of around 4.0%. With yields and credit risk substantially higher since these loans originated, refinancing this debt will be more costly and difficult given increased lending standards.
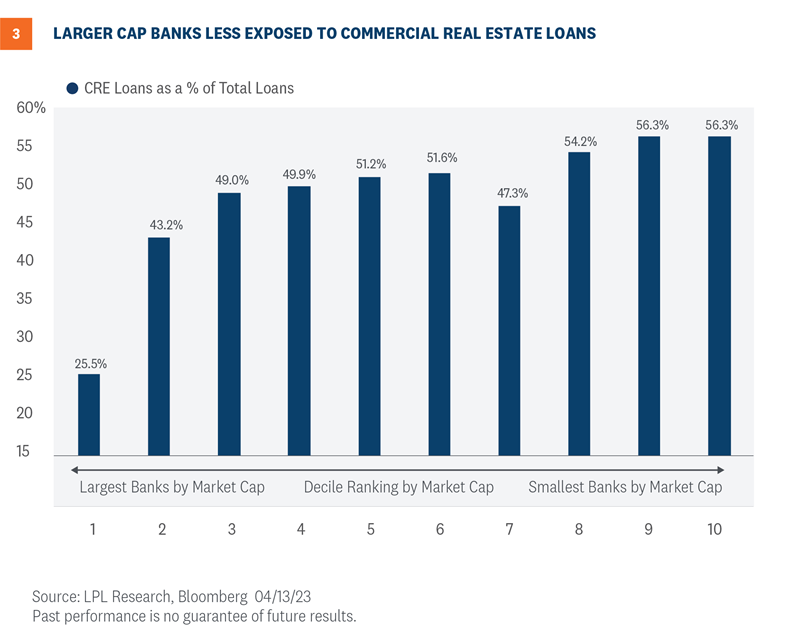
As noted above, banks are the largest holders of CRE loans. However, the proportion of CRE debt to total loans varies at the market cap level. In general, larger banks have less exposure as a percentage of their total loans compared to smaller-cap regional banks. For example, CRE loans comprise around 25% of all loans for the largest U.S. banks, shown in Figure 3 under the first decile grouping. This compares to smaller cap banks that have a CRE to total loan ratio of over 50%. What does this mean for investors? Going up in market cap within the banking space should help reduce CRE risk.
Credit cracks emerging
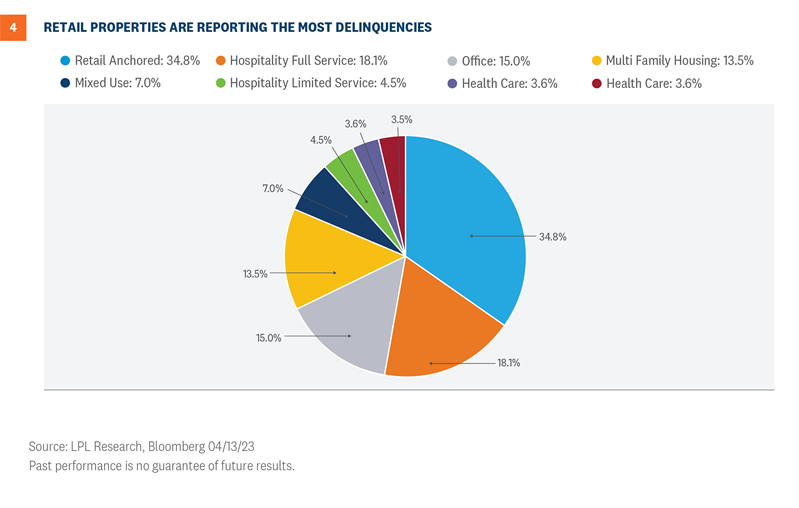
Historically low-interest rates helped cover some of the credit cracks within the CRE space after the pandemic. However, after last year’s meteoric rise in interest rates, delinquency rates have begun to rise, especially within the retail sector. As shown in Figure 4, roughly 35% of the loans pooled in anchored retail commercial mortgage-backed securities (CMBS) have reported delinquent payments that exceed three months. Delinquent payments that exceed three months within the hospitality full-service and office segments CMBS pools are at 18.1% and 15.0%, respectively.
Silver lining
The silver lining is that capitalization (cap) rates, which are used to estimate the return on investment for properties, have climbed to over 9% for the office space segment, marking nearly a 3.0% increase since 2021. Most retail cap rate categories are up around 2% since 2021. If the Federal Reserve (Fed) ends its rate hiking cycle and inflation continues to track lower, and the U.S. economy avoids a recession, attractive cap rates could provide some downside support as investors search for higher yields.
Summary
The commercial real estate market continues to face challenges from structural changes in the wake of the pandemic. Rising interest rates and the recent banking turmoil have shed new light on credit cracks developing in the retail and office space. Smaller-cap regional banks face increased exposure to the sector based on higher CRE loan concentrations. While the market has clearly priced in a lot of negativity for office REITs, rising delinquency rates and the upward trajectory of vacancy rates imply there could be more downside risk ahead.
Investment Outlook
Stocks may not get much support from earnings in the near term as the malaise continues. However, we do expect the market to benefit from the end of the Fed’s rate hiking campaign—likely in May. Higher interest rates may challenge stock valuations this year, but we still see the potential for additional gains for stocks over the next nine months.
LPL Research remains comfortable with its year-end S&P 500 fair value target of 4,300–4,400. While that target was set based on a price-to-earnings ratio (P/E) of 18 and a 2024 EPS estimate of $240, the P/E may be a bit higher and the earnings number a bit lower when all the results are in.
The LPL Research Strategic and Tactical Asset Allocation Committee (STAAC) recommends a slight overweight allocation to equities, narrowly favors value over growth, has moved to benchmark-level exposure for small and large caps, has the industrials sector as its top pick, and has warmed up to the technology sector, where the overall view is currently neutral, but the technical analysis picture has improved significantly this year.
Within fixed income, the Committee recommends an up-in-quality approach with a benchmark weight to duration. We think core bond sectors (U.S. Treasuries, Agency mortgage-backed securities (MBS), and short-maturity investment grade corporates) are currently more attractive than plus sectors (high-yield bonds and non-U.S. sectors) with the exception of preferred securities, which look attractive after having recently sold off due to the banking stresses.
Adam Turnquist, CMT, Chief Technical Strategist
https://www.rwmfinancialgroup.com/wp-content/uploads/2023/01/weekly-market-commentary-december-12.png450450R.W.M. Financial Grouphttps://www.rwmfinancialgroup.com/wp-content/uploads/2022/09/RWM_Brand-Identity_RGB_Wordmark_Color-1030x883.pngR.W.M. Financial Group2023-04-17 09:16:322023-04-17 09:16:34A Closer Look at Commercial Real Estate Market
First quarter earnings season kicks off this week with some big banks reporting toward the end of the week. In some ways this quarter’s earnings season will probably be déjà vu all over again—earnings declines and cautious guidance, reductions in estimates, but better than feared. However, tightened financial conditions in the wake of last month’s banking turmoil and building evidence for a slowing economy have changed the economic backdrop this quarter. It will be interesting to see how management teams react to these latest developments.
Setting the stage
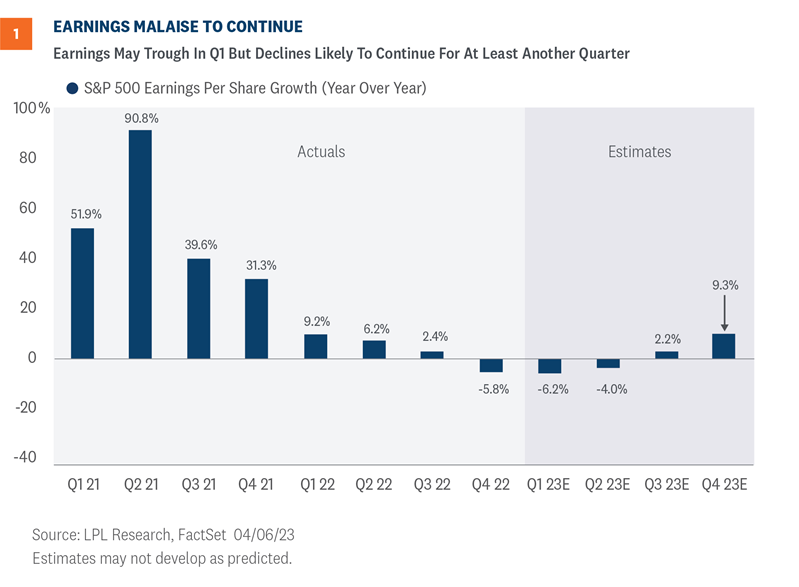
Corporate America faces some of the same headwinds it did during fourth-quarter earnings season, including slow global economic growth, cost pressures from still-elevated (but easing) inflation, some currency drag from a stronger U.S. dollar last quarter compared with the year-ago quarter, and geopolitical instability, particularly in Eastern Europe and China, that has put some upward pressure on costs. Add bank stress that will weigh on financial sector profits and we have the makings of another year-over-year (YOY) earnings decline for the S&P 500 Index in the first quarter. Any upside to the current consensus estimate for S&P 500 EPS at -6.2% YOY (source: Factset) will be difficult to achieve, (Figure 1), and a second straight quarterly miss—even if rare—may be in the cards.
It’s not all bad news though. Inflation pressures have continued to abate, potentially helping to mitigate pressure on profit margins. The labor market has loosened a bit, limiting wage increases. The U.S. dollar has come down about 10% since October 2022, which helps earnings from U.S.-based multinational companies. And while calls for recession have become commonplace, the U.S. economy very likely grew in the first quarter—consensus first-quarter gross domestic product (GDP) growth tracked by Bloomberg is 1.3%. Meanwhile, Europe’s economy continues to hold up better than most anticipated and will probably not be much of a drag.
Finally, the bar for this earnings season has been lowered quite a bit, with first-quarter estimates cut by 6% during the quarter, about double the long-term average.
Earnings and the economy are closely tied
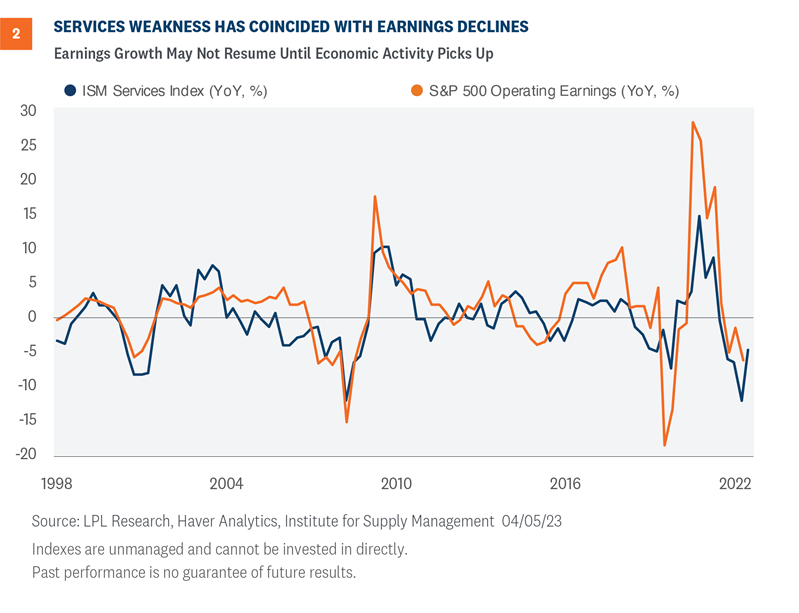
The weakness in the Institute for Supply Management (ISM) manufacturing and services indexes is a reason to expect earnings declines and weak guidance this quarter. Looking at services specifically, released on April 5, the index fell to 51.2 from 55.1, down from over 58 a year ago. This reading implies a weakening outlook for both businesses and consumers.
In Figure 2 we show the relationship between the ISM Services Index and S&P 500 operating earnings growth. Services is a much larger piece of the U.S. economy than manufacturing, but given corporate America is more manufacturing-oriented, the relationship with the manufacturing ISM, or the composite (manufacturing plus services) looks virtually identical.
The components of the ISM surveys provided further evidence of a slowing economy, including a 10-point drop month over month in services new orders. As the economy slows and inflation decelerates, the Federal Reserve (Fed) will be in a better position to pause the current rate hiking campaign, although that will likely be accompanied by weak earnings in the first half of this year, and potentially beyond.
Margin guidance will be the key
During fourth-quarter earnings season, a number of companies were rewarded for cost-cutting measures, particularly in the technology sector. For this upcoming earnings season, expect more of the same. Analysts will be sharpening their pencils when it comes to costs. Revenue will hold up fine—remember, the inflation we pay is more revenue for someone else.
Layoffs were initially constrained to tech names, where excessive hiring took place during the pandemic. However, recent announcements have spread to companies in other sectors, and the market’s response to more recent cost-cutting news has been mixed (McDonald’s and GM are examples). While layoffs help control costs and improve margins, they can also weigh on consumer spending and eventually translate into less business investment. On this score, the gradual pace of the labor market loosening, rather than a sharp reversal, has been positive. We hope to see wage pressures ease because of fewer openings rather than layoffs, which we saw this week in the Job Openings and Labor Turnover Survey (JOLTS).
We seemingly say it every quarter, but in this uncertain environment, guidance matters more than actual results. And specifically, cost/margin guidance is key.
Uncertainty reigns for the rest of the year
In two decades closely following strategists’ forecasts for S&P 500 EPS, it’s hard to recall a time when there was more disagreement about the path of profits. This is when looking at different scenarios can be helpful.
In a muddle-through economic scenario, we would expect S&P 500 earnings to hold up fairly well and potentially hit current consensus estimates of around $220.
In a mild, short-lived recession, perhaps $210 is a reasonable forecast.
In a typical recession that perhaps lasts a year, we would expect something closer to $200 per share in 2023 EPS, or about a 10% year-over-year decline.
If we probability weight these, with a slightly higher probability for muddling through (perhaps (50%), 35% odds for a short-lived, mild recession, and a 15% chance for a typical recession, we end up with a number in the $213–$215 range.
For now, we’ll keep our $220 forecast in place for 2023, but we would consider that number under review until we hear from corporate America. Our 2024 S&P 500 EPS number will almost certainly come down, but lower interest rates support higher stock valuations, so we think stocks will get to the same place by year-end. The 10-year Treasury yield, near 3.4%, was about 0.8% higher five weeks ago.
Investment Outlook
Stocks may not get much support from earnings in the near term as the malaise continues. However, we do expect the market to benefit from the end of the Fed’s rate hiking campaign—likely in May. Higher interest rates may challenge stock valuations this year, but we still see the potential for additional gains for stocks over the next nine months.
LPL Research remains comfortable with its year-end S&P 500 fair value target of 4,300–4,400. While that target was set based on a price-to-earnings ratio (P/E) of 18 and a 2024 EPS estimate of $240, the P/E may be a bit higher and the earnings number a bit lower when all the results are in.
The LPL Research Strategic and Tactical Asset Allocation Committee (STAAC) recommends a slight overweight allocation to equities, narrowly favors value over growth, has moved to benchmark-level exposure for small and large caps, has the industrials sector as its top pick, and has warmed up to the technology sector, where the overall view is currently neutral, but the technical analysis picture has improved significantly this year.
Within fixed income, the Committee recommends an up-in-quality approach with a benchmark weight to duration. We think core bond sectors (U.S. Treasuries, Agency mortgage-backed securities (MBS), and short-maturity investment grade corporates) are currently more attractive than plus sectors (high-yield bonds and non-U.S. sectors) with the exception of preferred securities, which look attractive after having recently sold off due to the banking stresses.
Financial markets and the Federal Reserve are reading from two different playbooks. Who is right? The markets are pricing in several rate cuts by the end of this year, while the Federal Reserve communicated more rate hikes with an expectation of holding rates up throughout the balance of 2023. We think that markets have it right, but several factors need to play out for this outcome to prevail. If growth stalls and inflation materially slows, the Fed could cut yet keep real rates positive. Read more below for our reasoning and for what it means for your investments.
Rising Layoffs Could Ease Wages
The Federal Reserve (Fed) has reiterated its plan to raise rates at least one more time and keep rates elevated for the rest of 2023. At this stage of the economic cycle, the Fed is rightfully focused on its inflation mandate but as the economy slows and inflation cools, we think the Fed can shift to a more balanced focus on both price stability and full employment.
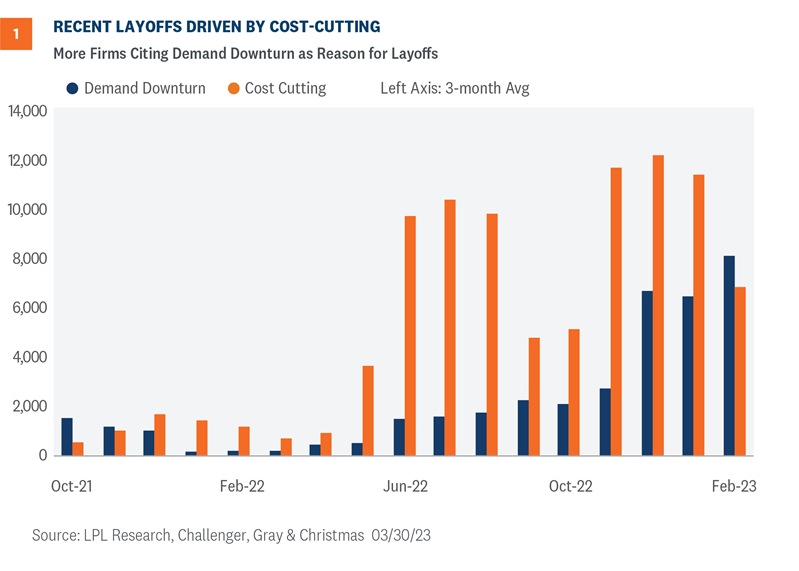
The labor market will be key to the outlook on rates this year. With yet another tech company announcing layoffs, the labor market should loosen as the economy slows and businesses tighten spending. Firms are laying off more of their workers as the economy is expected to slow down in Q2, releasing some of the wage pressure in the current job market. Before this year, most layoffs were driven by firms cutting costs, but now, firms are explicitly stating weaker demand as the reason for layoffs (Figure 1).
As the economy slows and firms experience a downturn in demand, additional companies will likely cut payroll in the coming months. A natural consequence of a smaller workforce will likely be reduced demand for office space, putting additional pressure on commercial real estate.
Despite rising layoff announcements, markets are taking these news items in stride, most likely because the slowdown in the economy and tighter financial conditions imply the Fed is close to the end of rate hikes. Recession risk is still elevated, which explains why markets and the Fed are at odds about the future path of interest rates. Markets are probably right that the Fed will cut rates by the end of the year.
Services Inflation Still a Problem
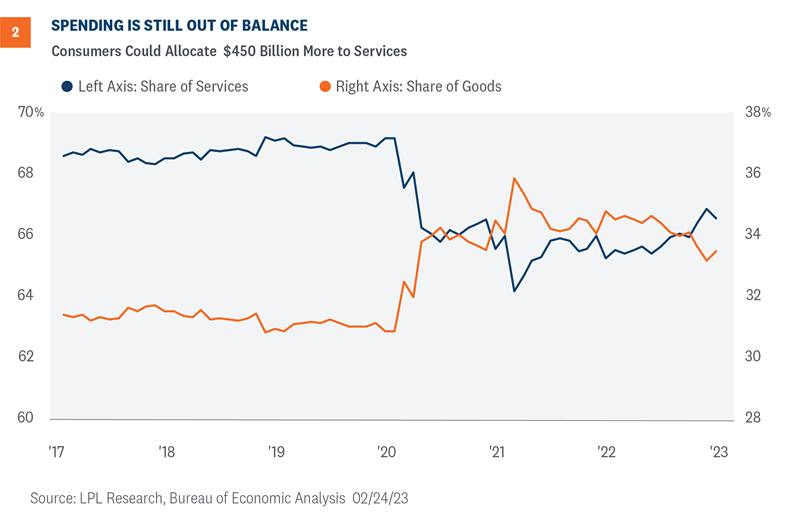
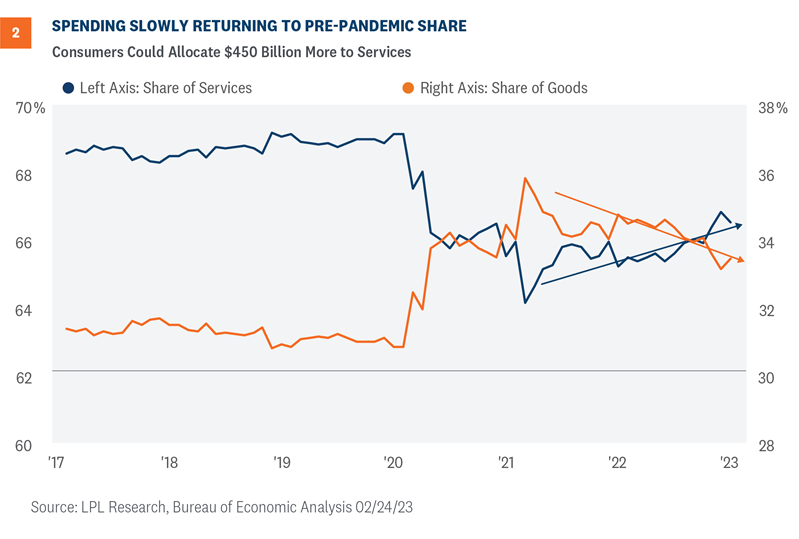
One reason the Fed is consumed with breaking inflation is that the improving trend in headline inflation is from declining goods prices. In contrast, services prices are stubbornly elevated, meaning consumer demand must fall if services inflation is to cool. But as the demand for services is strong as consumers release pent up demand, prices in many service sectors will likely remain elevated in the near term. Investors are watching the slow recalibration of goods and services spending. During those early years of the pandemic, consumers reallocated toward spending more on goods and less on services. The return to “normal” has been slow, as the share of services spending is still roughly 2.5 percentage points below pre-pandemic share as of the latest report (Figure 2).
Investors should take note of the composition of spending to understand the underlying inflationary trends. This differential means consumers could reallocate roughly $450 billion from goods to services as the composition of spending normalizes throughout the year. Investors and policy makers must accept that inflation metrics will be skewed until consumers recalibrate their composition of spending. Transportation services prices outright declined for the first time in three months due to a decline in airline prices. If consumers have more pent up demand for travel and experiences, prices within travel-related sectors could stay elevated through the summer. When it comes to housing, data show that prices for new leases are falling, so it’s just a matter of time before the official metrics capture this downward trend.
Treasury Markets
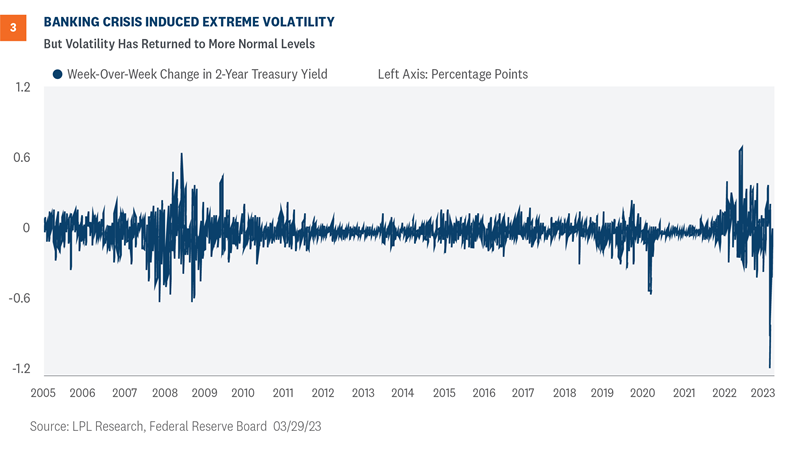
Changing Fed rate hike expectations can be seen clearly in the elevated levels of volatility in the normally staid U.S. Treasury market. The 2-year Treasury yield, which is most sensitive to policy expectations, saw daily moves of plus or minus 0.20% during the banking crisis. Moreover, it averaged about half a percentage point (50 basis points) between the highs and lows each day that week. A move of a couple of basis points is usually considered a lot for the security.
The erratic movements were likely being exacerbated by poor liquidity in the Treasury market. A Bloomberg index shows trading liquidity for Treasuries has gotten five times worse since 2021, and outside of a short spike in the early days of the pandemic, is worse than at any time since the financial crisis. Nonetheless, the volatility in presumably the safest bond market in the world has been unprecedented. We would advise investors to take advantage of any back up in yields and add high-quality fixed income exposure. Those investors who are fully allocated to fixed income should view recent volatility as more noise than signal.
What does this mean for you?
We think the economy will eventually hit its stride, notwithstanding unforeseen global shocks. Hitting that stride may not come until the Fed’s rate hiking campaign is closer to its end, but we expect stock investors to benefit once it does. Higher interest rates are challenging stock valuations and perhaps pushing the gains further out in 2023, but we still see solid potential for double-digit—if not mid-teens—returns for stocks this year. The S&P 500 returned more than 7% in the first quarter, so it’s well on its way to a double-digit year.
The LPL Research Strategic and Tactical Asset Allocation Committee (STAAC) recommends a slight overweight allocation to equities, narrowly favors value over growth, has moved to benchmark-level exposure for small and large caps, has the industrials sector as its top pick, and has warmed up to the technology sector, where the overall view is currently neutral but the technical analysis picture has improved significantly this year. The Committee has reduced its allocations to the energy and healthcare sectors in response to weakening technical analysis trends.
Within fixed income, the Committee recommends an up-in-quality approach with a benchmark weight to duration. We think core bond sectors (U.S. Treasuries, Agency MBS, and short-maturity investment grade corporates) are currently more attractive than plus sectors (high-yield bonds and non-US sectors) with the exception of preferred securities, which look attractive after having recently sold off due to the banking stresses.
Jeffrey Buchbinder, CFA, Chief Equity Strategist
Lawrence Gillum, CFA, Fixed Income Strategist
Jeffrey Roach, PhD, Chief Economist
https://www.rwmfinancialgroup.com/wp-content/uploads/2023/01/weekly-market-commentary-december-12.png450450R.W.M. Financial Grouphttps://www.rwmfinancialgroup.com/wp-content/uploads/2022/09/RWM_Brand-Identity_RGB_Wordmark_Color-1030x883.pngR.W.M. Financial Group2023-04-03 09:47:302023-04-03 09:47:34Who Is Right, Federal Reserve or Financial Markets?
A lot has changed in the past few weeks, both in terms of expectations for interest rates and lost confidence in the health of the banking system as a result of the sharp rise in interest rates that has led to some things “breaking,” as we wrote about here last week. Here we share some thoughts on who’s to blame for the ongoing banking crisis and reiterate how we are telling investors to adjust, or not adjust, their asset allocations in light of ongoing market volatility.
Markets On Alert
It’s difficult to grasp that just a few weeks ago, the fed funds futures market had priced the terminal rate at nearly 6%. The market’s hawkish outlook was predicated on the Federal Reserve (Fed) raising rates amid a still solid economy underpinned by a tight labor market and consumer spending, but with inflation still above the 2% level that reflects price stability.
Now, with continued pressure on both domestic and global banks, markets are expecting the Fed will be forced to cut rates towards the end of this year as loan growth slows and businesses, particularly small businesses, and consumers find it more difficult to secure loans. As a result, the broader economy is expected to be negatively affected.
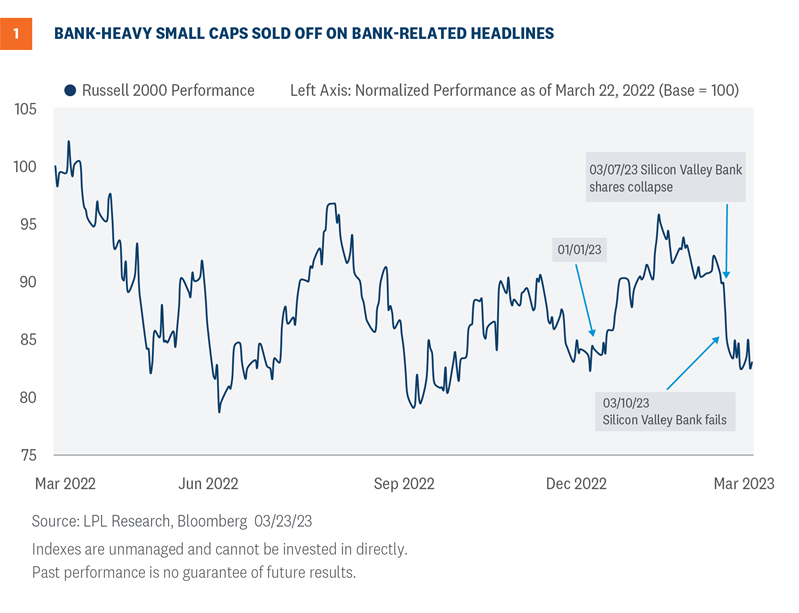
The rapid collapse of Silicon Valley Bank (SVB), followed by continued pressure on regional banks, along with headlines surrounding the struggle to shore up confidence in First Republic Bank (FRC), has the market on alert for other potentially vulnerable banks. The banking stress of the past couple of weeks has put some heavy pressure on the bank-heavy small cap Russell 2000 Index (Figure 1).
The swift crash of Signature Bank, the third largest bank failure in U.S. history, following the demise of SVB, which held $160 billion in deposits, along with Silvergate Bank, has investors and depositors questioning if the banking system is as “sound and resilient with strong capital and liquidity” as suggested recently by both Fed Chair Jerome Powell and Secretary of the Treasury Janet Yellen.
To be sure, the Fed’s emergency bank lending facility, the Bank Term Funding Program, which was quickly put in place to help strengthen the banks, also served to restore confidence as banks grapple with depositors who are seeking higher rates elsewhere, and who are also increasingly concerned about the viability of the banks themselves.
Finger pointing: Who’s to blame?
No sooner had news regarding the run on SVB hit the media, generalized fear and panic spread quickly. Depositors mounted a modern-day run on the bank using their smart phones, and over the course of 36 hours, the bank was forced to sell $21 billion of long duration bonds at a loss of $1.8 billion.
The blame was quickly focused on venture capitalists who sent out immediate warnings to their start-up companies to withdraw their funds at once. SVB’s large client base was broadly made up of fledgling technology companies backed by venture capital. It didn’t take long for depositors to exit.
A widely followed newsletter that covers the venture capital world, “The Diff,” has also been considered the spark that led to the mass exodus of deposits, when in late February the report indicated that SVB’s debt-to-asset ratio was 185 to 1, implying that the bank was virtually insolvent. The underlying culture of the tech world has also come under scrutiny as to how rapidly conclusions were drawn and how instantaneously they were acted upon.
Mismanagement and regulatory failures
The deficit of a functioning risk management team has been the most enduring criticism of SVB, while criticism has similarly been leveled at the supervisory team at the San Francisco Fed, which is supposed to monitor the operations of the banks within its regulatory jurisdiction. The lack of communication from the bank’s senior leadership didn’t help matters.
Silvergate Bank, with $12 billion in deposits, is most closely associated with crypto activities, but suffered a swift run on its holdings around the same time as the SVB failure. Despite early warnings of fragility in the wider crypto world, and with risks climbing, there was apparently, according to media reports, little contact with supervisors from the San Francisco Fed.
At the Federal Open Market Committee (FOMC) meeting press conference on March 22, Powell addressed criticism that there wasn’t any supervision of operations at SVB. He stressed that there were red flags raised months ago by examiners from the San Francisco Fed, but he couldn’t say whether the warnings were escalated. “We’re doing the review of supervision and regulation,” Powell said, and “My only interest is that we identify what went wrong here.”
Senator Elizabeth Warren, the leading Democrat on the Senate Banking Committee, blamed Powell for the banking crisis in no uncertain terms, saying that he was an integral part of the process that weakened regulatory oversight of regional banks, “Fed Chair Powell’s actions contributed to these bank failures.”
Monetary and fiscal policy
Moving up the blame chain leads directly to the monetary and fiscal policies that flooded the banking system with government transfers to consumers and small businesses, coupled with interest rates that stayed near zero for too long, which allowed risk to intensify across the investing spectrum.
With the Fed’s insistence that the inflationary effect was “transitory” and primarily due to COVID-19-related supply chain challenges, the central bank was slow to begin raising interest rates. With financial conditions remaining loose, risk taking was elevated in venture capital, private equity, and real estate, especially commercial real estate. But as the Fed finally launched its aggressive rate hiking campaign, the dynamic changed.
The collapse of SVB, followed by the other banks that were victims of the immediate panic that ensued, is emblematic of the changing landscape. When all is said and done, the blame falls on all of the above for failing to recognize the risks associated with policies that allowed risk taking but then quickly turned off the spigots.
Asset Allocation Views
In the current environment of elevated volatility and concerns about banks, LPL Research believes tactical investors should still maintain multi-asset allocations at or near benchmark levels with an emphasis on diversification.
Within fixed income, LPL Research continues to like the preferred sector to take advantage of attractive valuations with less risk than equities.
Within equities, the technology sector looks better to us here, which, along with the Strategic and Tactical Asset Allocation Committee’s (STAAC) recent decision to downgrade healthcare to neutral, suggests limiting the size of any style tilts toward value. The Committee continues to take a wait and see approach on the banks while closely watching the latest developments. Finally, precious metals-related investments warrant consideration on the long side, in our view.
Quincy Krosby, PhD, Chief Global Strategist, LPL Financial
The Federal Reserve (Fed) has a history of raising short-term interest rates until something “breaks.” Considering the Fed has raised rates from a near-zero level to 4.75% (upper bound) over the course of only one year, it was almost a near certainty this time would be no different. Recent bank failures suggest things are indeed starting to break. However, we don’t think we’re on the brink of a full-blown crisis, as market indicators we follow suggest contagion risks are still currently low. And while we don’t think a full-blown crisis is imminent, financial stability risks have clearly increased, which makes a prudent asset allocation plan a must.
Contagion
The aftermath of the Silicon Valley Bank (SVB) and other bank failures in the U.S. rippled into Europe last week as Credit Suisse’s (CS) troubles moved firmly into the spotlight. The Swiss bank’s shares slid to an all-time low on Wednesday after the Saudi National Bank (which owns almost 10% of CS) stated it would not provide additional financial support after CS earlier acknowledged “material weakness” in its financial reporting. This followed a series of missteps and compliance issues that have hindered the bank’s global standing in recent years.
Then, on Thursday, the Swiss National Bank (SNB) issued a note aiming to regain confidence in CS, saying they “will provide liquidity to the global active bank if necessary”. Hours later CS announced it had taken the SNB up on this offer and would borrow up to $54 billion (50 billion Swiss Francs) in what the bank called a “decisive action to pre-emptively strengthen its liquidity.” After a week of such high drama, which culminated in UBS’ takeover of Credit Suisse over the weekend, we look at a few key indicators to gauge how various market indicators we watch are reacting to the turmoil in the banking sector.
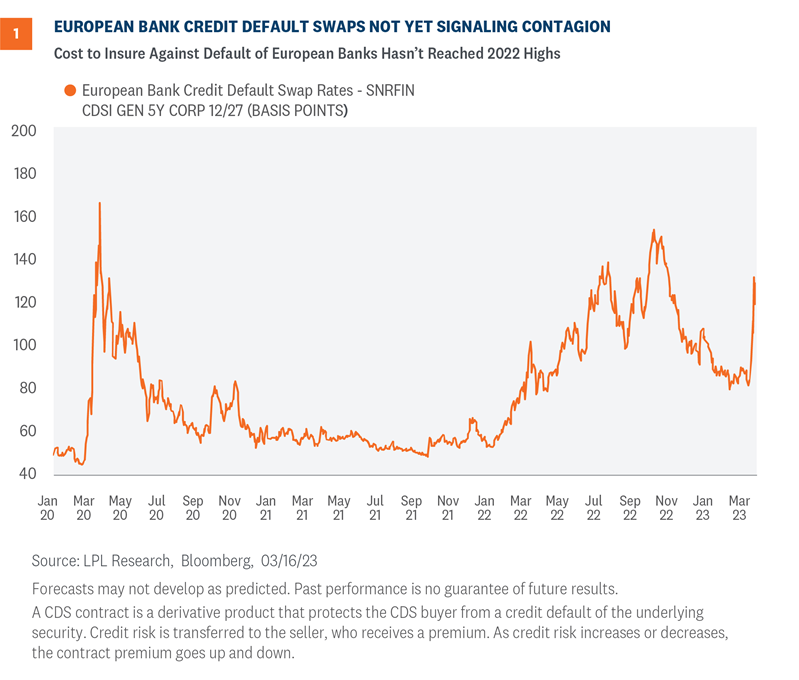
The word at a the top of everyone’s mind at the moment is “contagion”: Will the troubles at SVB, CS, and others spread to the wider banking sector and lead to a 2008-like banking crisis? Credit Default Swaps (CDS), a derivative financial instrument that market participants can use to insure against default, on European banks so far don’t seem to be indicating contagion in the European banking sector (Figure 1). Prior to the UBS tie-up, the CDS on CS may have reached deep distressed levels not seen at a major global bank since the financial crisis, but European bank sector CDS are still below levels seen as recently as fall 2022.
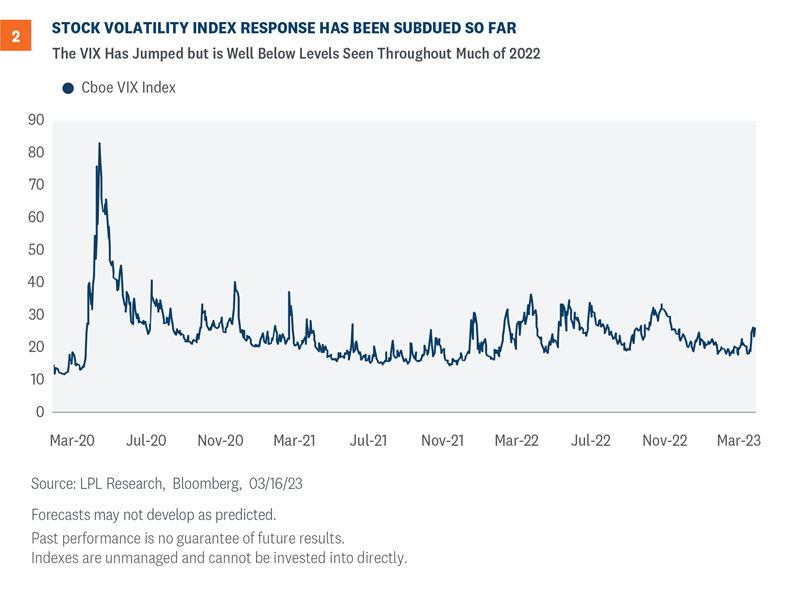
Back to domestic equity markets, the CBOE (Chicago Board Options Exchange) Volatility Index, commonly referred to as the VIX, is sometimes known as the “fear gauge”. Based on the VIX, the response to banking troubles from equity markets has been fairly subdued and certainly hasn’t indicated a wider panic is taking hold in the markets. The VIX is near 25, up around 6 points, or 30%, since the middle of last week, but this level only places it in the top 39% of readings over the last year (although the last year has been abnormally volatile and over the last 10 years the current reading would be in the top 13%) (Figure 2).
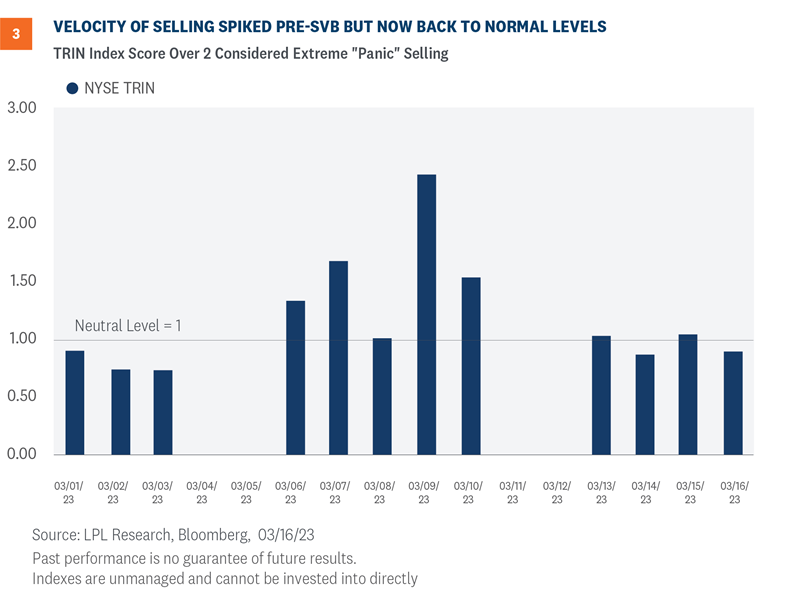
A market sentiment indicator we watch to assess stock selling pressure is the New York Stock Exchange (NYSE) Short Term Trading Index (TRIN), also known as the ARMS index. It is a technical indicator that measures the velocity of trading by looking at advancing/declining volumes and advancing/declining stocks. A TRIN score above 2 can be interpreted as a signal that the velocity of selling is at an extreme, while around 1 is considered neutral. The velocity of selling did spike on Thursday last week, indicating some panic sellers, but since then the TRIN has been at very average levels (Figure 3).
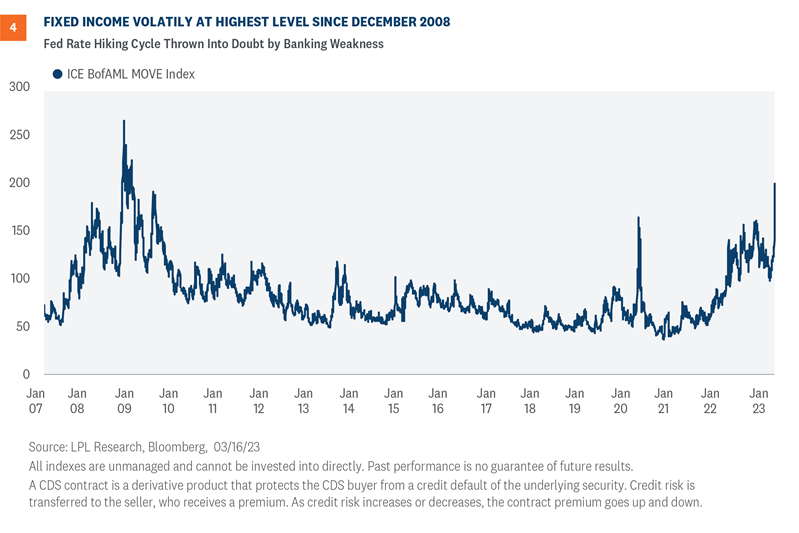
A more extreme signal is coming from the bond markets where the MOVE Index (Merrill Lynch Option Volatility Estimate) is hitting levels not seen since 2008. The MOVE Index tracks the expected volatility of U.S. Treasury yields implied by option prices (much like the VIX does for equities). Generally, the MOVE and VIX tend to be correlated but do diverge significantly at times, as they are now.
Volatility in Treasuries has been rising since the start of 2021 when the bond markets started sniffing out that the Fed may need to take action to tackle rising inflation and has been extremely elevated since the start of 2022. What was already an important rate decision this week has taken on epic proportions since the banking turmoil. Fed Chair Jerome Powell seemed to have opened the door to a 50 basis point (0.5%) hike during his congressional testimony (pre-SVB) and now he is caught in a tough spot between sticking with even a 25 basis point (0.25%) hike or pausing and not hiking at all to help ease stress on the banks. All of this uncertainty has sent the MOVE index skyrocketing (Figure 4).
Other Financial Indicators
The financial indicators listed above are just some of the metrics we use to measure financial market stress. Other, more traditional metrics, such as U.S. high yield corporate credit spreads and the health of the short-term funding markets, also suggest the recent banking challenges are contained. Certainly, this is a highly fluid situation, and we know confidence in the banking system is key in preventing these isolated events from turning into something more systemic, but from our seats, we do not think a banking crisis is imminent.
Asst Allocation Views
It’s easy to forget about long-term investment objectives when markets are fluctuating widely, but it is those moments when sticking to a well thought out plan is most critical. It’s also a reminder why a diversified asset allocation plan is important.
In response to ongoing market volatility, we would consider adding preferred securities exposure to fixed income allocations. At this point, we are taking a wait and see approach on the banks while closely watching the latest developments. The technology sector looks better to us here, while precious metals warrant consideration on the long side.
Our updated thoughts on asset allocation are outlined below.
Equities vs. Fixed Income. LPL Research’s Strategic and Tactical Asset Allocation Committee (STAAC) remains slightly overweight equities after the Committee reduced its suggested equity exposure and moved higher in quality in fixed income about three weeks ago. While we believe investors should react to recent developments in the banking sector with some caution due to ongoing risk of deposit flight, the backstops provided by central banks and bank regulators over the past week have given us confidence the crisis will be contained. But sentiment remains fragile and technical indicators we follow suggest some caution is prudent.
Value vs. Growth. The recent dip in interest rates and our technical analysis work suggest it makes sense to shift some toward growth and get closer to neutral despite above-average valuation discounts on the value side. The Committee now recommends benchmark technology sector exposure.
Small Caps vs. Large Caps. The near-term outlook for small cap stocks is challenged given larger financial sector weights, but the asset class offers compelling valuations, in our view, to support attractive returns over the next 9 to 12 months—our targeted tactical asset allocation time horizon.
Developed International vs. Emerging Markets. European bank stress and a potential flight-to-safety rally in the U.S. dollar create near-term headwinds for developed international equities. The STAAC remains comfortable with its neutral stance, its underweight position in emerging markets equities, and slight overweight for U.S.
Financials Sector. The ongoing fragility of the banking system, coupled with the negative impact on bank profits from these recent events, leaves us neutral on financials for now with a strong preference for high quality. Fundamentals and valuations suggest the insurance industry looks ripe for opportunities.
Commodities. We consider precious metals an attractive opportunity, particularly gold, in this macro environment. Rising recession risks have weighed more heavily on industrial metals and energy, offsetting catalysts from China’s ongoing economic reopening. The technical setup for West Texas Intermediate (WTI) has deteriorated, and we are waiting for more evidence of price stability before making a bullish call on oil.
Fixed Income Positioning. On the fixed income side, the Committee continues to believe a mostly up-in-quality approach makes sense. Core bond sectors (U.S. Treasuries, Agency mortgage-backed securities [MBS], investment grade corporates) offer income potential and provide diversification to equity market stresses. Preferred securities are the only “plus” sector we believe is worth a small allocation due to valuation discounts offered by the ongoing bank health concerns. The STAAC continues to view high-quality core bonds as good diversifiers offering attractive yields in the current environment.
Bottom line, we believe tactical investors should be maintaining their multi-asset allocations at or near benchmark levels with an emphasis on diversification. We continue to monitor bank industry and macro conditions and will communicate any changes to our tactical views as they occur.
George Smith, CFA, Portfolio Strategist, LPL Financial
Lawrence Gillum, CFA, Fixed Income Strategist, LPL Financial
https://www.rwmfinancialgroup.com/wp-content/uploads/2023/01/weekly-market-commentary-december-12.png450450R.W.M. Financial Grouphttps://www.rwmfinancialgroup.com/wp-content/uploads/2022/09/RWM_Brand-Identity_RGB_Wordmark_Color-1030x883.pngR.W.M. Financial Group2023-03-20 08:43:192023-03-21 08:44:59Wading Through Financial Stability Risks: An Action Plan
Last week did not play out how we anticipated. Coming into the week, it was all about Federal Reserve (Fed) Chair Jerome Powell’s congressional testimony and the February jobs report. Instead, we got a shockingly fast collapse of a financial institution with over $200 billion in assets, which turned the market’s focus toward the stability of the banking system and what systemic risks banks might be facing. This commentary is focused on our asset allocation views, but no doubt the Silicon Valley Bank saga will require more attention from investors in the days ahead.
A tough environment for asset allocators just got tougher with the events of the past few days. For the “no landing” crowd thinking strong consumer spending and low unemployment would keep this economy growing until the inflation fight is won, they now have to consider signs of stress in the banking system after the failure of SVB Financial (commonly known as Silicon Valley Bank). See the LPL Research blog for our latest thoughts on that situation.
The stock market bulls also had to absorb hawkish testimony from Fed Chair Powell that led the bond market to increase the chances of a 50 basis point rate hike on March 22 (though those expectations unwound following the SVB news). Add to that a troublesome last round of inflation data and the most inverted yield curve in four decades, based on 2- and 10-year Treasury bonds, and the bulls don’t have the firmest ground to stand on.
But this market has also made it tough for the bears to get it right. The cyclical, so-called “high beta” stocks have been outperforming—the late-week selloff in the banks notwithstanding. Double-digit gains from the October lows were accompanied by strong breadth—a sign of a healthy bull market with a broad range of stocks participating in the rally. Recent economic data has pointed to continued growth—giving rise to the “no landing” narrative. Earnings estimates have held up better than many expected. We’re in a very strong seasonal period for stocks, based on the four-year presidential cycle (year three has an average gain of 16.8%, higher 89% of the time since 1950). Fed pauses—likely coming fairly soon—have historically been followed by double-digit returns one year later, on average.
So the case for gains this year seems strong based on history, enough for the LPL Research Strategic and Tactical Asset Allocation Committee (STAAC) to continue to recommend an overweight equities position. However, the pressure on valuations from higher interest rates, which have made bonds attractive alternatives, led to the Committee’s recent decision to reduce the size of the overweight from 5 points to 3.
Not Enough Evidence to Switch Back to Growth
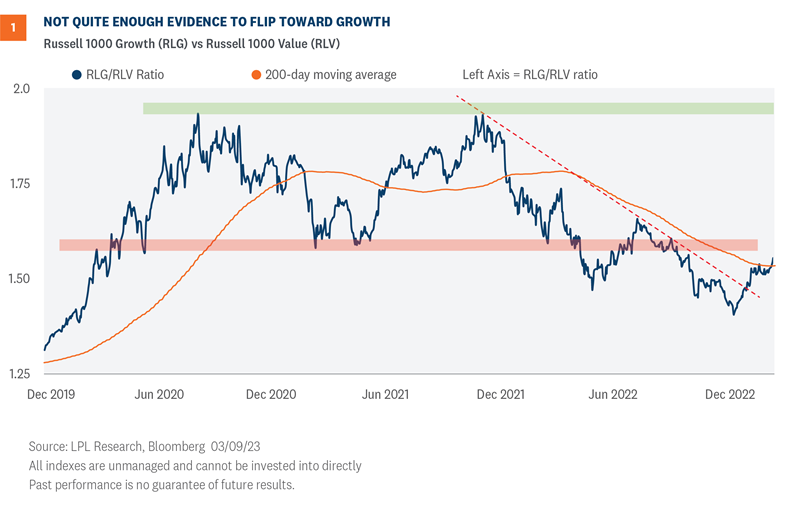
Growth stocks have come storming back in 2023 after significantly underperforming their value counterparts in 2022. The Russell 1000 Growth Index has returned 4.6% year to date, compared to the 2.3% decline for the value index. The question now is have growth stocks shown enough to reclaim leadership and sustain the outperformance.
Starting with the technical analysis picture, the improving relative strength has pushed the Russell 1000 Growth (RLG)/Russell 1000 Value (RLV) ratio chart back above its declining 200-day moving average. However, technically, the ratio chart has yet to recapture the lower end of its prior range and until that area of overhead resistance is cleared, we believe the sustainability of growth outperformance remains questionable (Figure 1).
From a fundamental perspective, the near-term outlook for the value style has gotten much tougher following the banking selloff last week. Financials are the biggest value sector, composing 20% of the Russell 1000 Value Index, compared with just 3% of the Growth Index.
But valuations strongly favor value over growth. Despite the strong 2022 for value in which the Russell 1000 Value Index outperformed the Growth Index by more than 20 percentage points, the Value Index still trades at a 38% discount to growth compared with the respective 10- and 20-year average discounts of 28% and 25%.
Other reasons the STAAC maintains a slight preference for value include the Committee’s favorable view of energy, which is the second biggest value sector, and value’s record of outperformance during rising interest rate and high inflation periods.
Small Cap Valuations Offer Some Cushion for Business Cycle Risks
Small caps would typically not be one that asset allocators would recommend when some of the most prescient leading economic indicators are sending strong recession signals. They tend to do better early in economic cycles once the economy emerges from recession. If the common—though not quite unanimous—view that recession may come in 2023 or early 2024 turns out to be right, then the sweet spot for small caps may be a year or more away.
But small caps have performed relatively well this year, despite the economic uncertainty. The S&P 600 small cap index has returned about 1.5% year to date, while the Russell 2000 Index is up 0.9%, after both lost more than 7.5% last week.
We would cite valuations as the primary reason small caps have held up amid concerns about stress in the banking system (which we do not see as systemic). The small cap indexes carry more financials than large caps, (about 8% more based on the Russell 2000 and S&P 500 indexes) and generally companies’ balance sheets are not as strong.
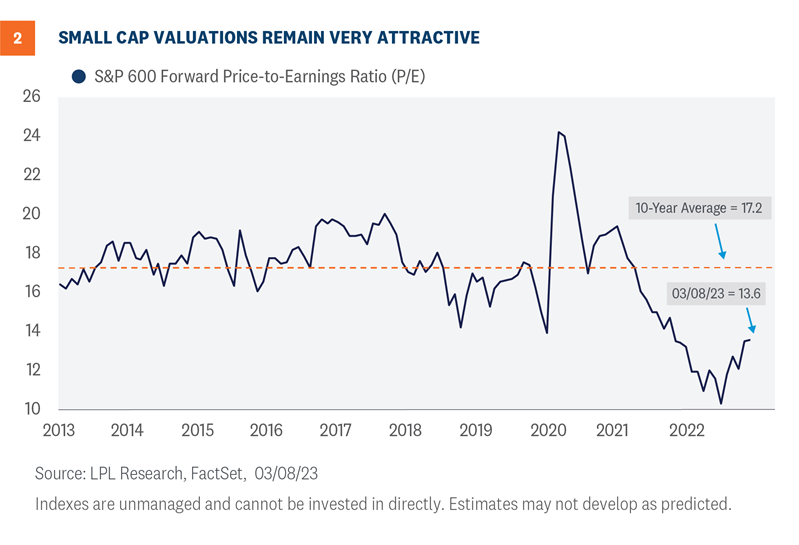
Small caps look cheap enough to us here to favor despite these risks. As shown in Figure 2, the S&P 600 Small Cap Index trades at a 13.6 price-to-earnings ratio (P/E), well below its 10-year average at 17.2. For comparison, the S&P 500 Index trades at a 17.2 P/E, right in line with its 10-year average.
The technical setup for large caps versus small caps, based on the ratio chart for the S&P indexes, remains in a downtrend and below its declining 200-day moving average, implying the trend still favors small cap outperformance ahead.
Developed International A Worthy Alternative to The United States
LPL Research’s outlook for developed international equities has improved in recent months. Based on the combination of improving technical analysis trends, attractive valuations, and resilient performance by European economies thanks to falling energy prices, the STAAC’s allocation to international has been increased to near that of U.S. equities. Specifically, the Committee recommends a neutral allocation to international and a 3-4% overweight to U.S. equities.
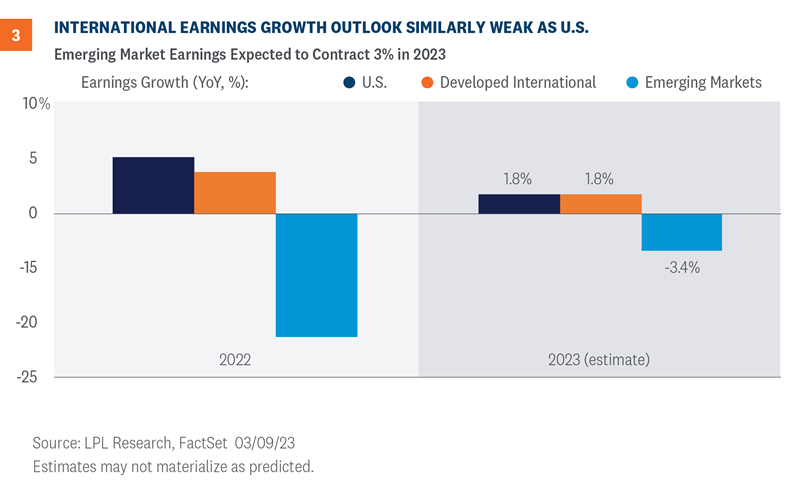
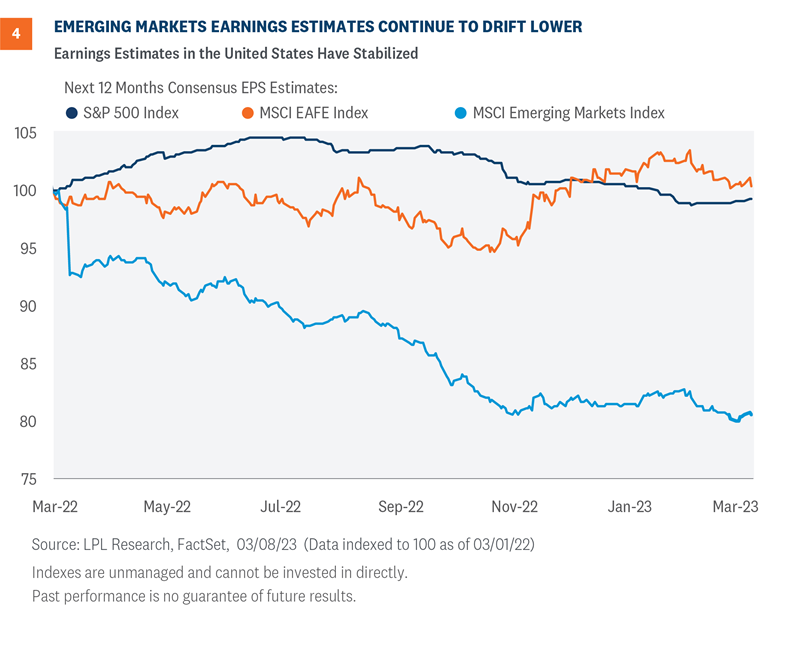
The earnings growth picture suggests a similar outlook for developed international and U.S. equities, as shown in Figure 3. These are just estimates, but consensus currently reflects 1.8% growth in earnings for the S&P 500 and MSCI EAFE indexes. The outlier is emerging markets (EM)—the MSCI EM Index is expected to see a 3.4% decline in earnings in 2023.
Not only is EM expected to see earnings fall this year, the momentum in those estimates is clearly negative (Figure 4). The U.S. earnings estimate trend is starting to inch higher, recent strength in international estimates has begun to roll over, and EM estimates have drifted lower over most of the past year. These earnings trends generally match our views on these three regions. Ongoing U.S.-China tensions and regulatory uncertainty add to our EM concerns.
From a technical perspective, international developed continues to outperform U.S. equity markets. The MSCI EAFE Index vs S&P 500 ratio chart has been climbing higher since October, with no signs of a trend change on the horizon. Emerging markets are beginning to look more constructive on a technical basis; however, there is insufficient technical evidence to make the call for a trend change at this time. Based on this backdrop, we prefer international developed markets over emerging markets. The STAAC’s next move is more likely to be upping developed international equities rather than emerging markets.
Conclusion
In conclusion, LPL Research maintains a slight preference for equities over fixed income, value over growth, small caps over large caps, and U.S. and developed international over emerging markets. The STAAC continues to watch for more clarity as to how long the inflation problem will persist, how far the Fed will have to go to tame it, and whether the U.S. economy can prove its skeptics wrong, muddle through, and avoid a recession. The failure of Silicon Valley Bank doesn’t make the road ahead for the economy any easier, but it may offer a silver lining for markets by slowing the Fed down.
Suggesting an economy makes “no landing” makes no sense. Analogies eventually break down, especially this one. Economic activity does not stop like an airplane eventually does, but rather the economy will settle into a steady state where growth is consistent with factors such as population and productivity. Here we take a look at some factors that illustrate how the economy is struggling to find a stable growth path.
Why the “Landing” Analogy?
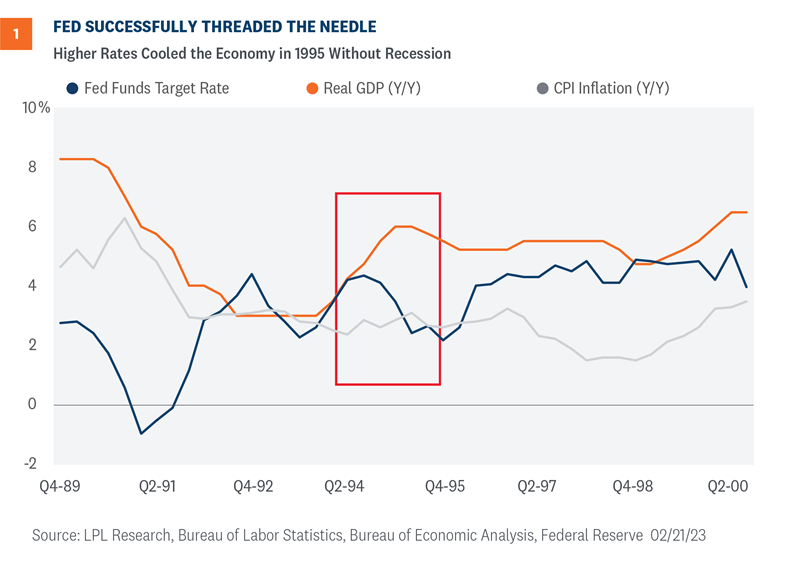
We need to go back a few years to recall when investors began using the “landing” analogy. During the hot summer of the mid-1990s, the Honorable Alan Greenspan spoke to the Economic Club of New York, where he was introduced as “the pilot we are all counting on for that very smooth and we hope very soft landing.”
Perhaps that was not the first time market watchers used the term, but the conversations at the Economic Club of New York were prescient. The hope for a soft landing came to fruition. The economy started overheating in 1994, so the former chairman of the Federal Reserve (Fed) raised rates, cooled the overheated economy, and the country escaped a second recession that decade (Figure 1).
What is A Soft or Hard Landing?
A soft landing is when economic growth slows but remains positive as the economy sets up for a long-term sustainable growth path. In contrast, a hard landing means the country falls into recession to break the overheated economic machine. One assumption behind the analogy is an overheated economy is not on a sustainable growth path, so policy makers ought to tighten financial conditions to improve the economy’s chances of reaching a stable growth rate.
Why A “No Landing” Makes No Sense
Suggesting an economy makes “no landing” makes no sense. Analogies eventually break down, especially this one. Economic activity does not stop like an airplane eventually does, but rather the economy will settle into a steady state where growth is consistent with factors such as population and productivity.
So perhaps it’s time to rethink the use of the “landing” analogy and use one related to that of a runner. Runners often talk about the various phases of the race. One important phase is when runners transition from the acceleration phase, when they focus on increasing stride length and frequency, to a steady state, when runners focus on maintaining stride length and frequency over time. Central bankers are looking for ways to get the economy “hitting its stride” with a consistent, sustainable growth path and stable prices.
Factors Keeping the Economy Off-Stride
The conundrum is investors are regularly receiving a mix of both good and bad news. One example is the slow recalibration of goods and services spending. During those early years of the pandemic, consumers reallocated more on goods and less on services. The return to “normal” has been slow as the share of services spending is still roughly 2.5 percentage points below pre-pandemic share as of the latest report (Figure 2).
Investors should take note on the composition of spending to understand the underlying inflationary trends. This differential means consumers could allocate roughly $450 billion in services as the composition of spending normalizes throughout the year. Investors and policy makers must accept that inflation metrics will be skewed until consumers recalibrate their composition of spending. Watch for renewed demand for health care, communication services, retail, and financial services.
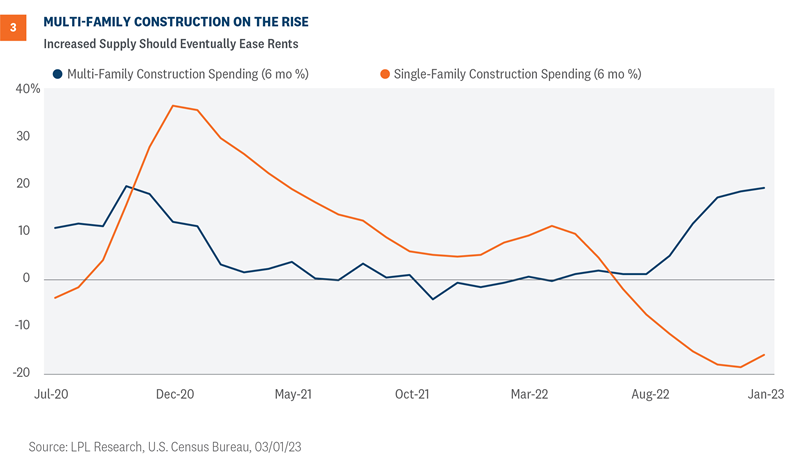
Another conundrum is the divergence of construction activity between single-family versus multi-family dwellings, but growing multi-family construction activity is clearly a good sign for renters in this country (Figure 3).
The growth in condo and apartment construction means the supply of multi-family units will increase this year as more projects come to market. New multi-family projects will likely dampen rents as more properties come online, so we should expect rent prices to decline this year as supply of units grows. Industry data already show declining rent prices, so it’s just a matter of time before the official government statistics reflect that easing. Investors and policy makers alike should expect a softening in housing-related inflation in the coming months.
What Does This Mean For You?
The Fed wants to tighten financial conditions so the economy can smoothly transition from the post-pandemic reopening phase—when the economy grew 5.9% in 2021 and 2.1% in 2022—to a more sustainable rate that neither stokes inflation nor stalls economic growth.
If the economy can break the back of inflation without a deep and prolonged recession, investors will likely experience markets that could return to lower volatility and improved conditions for both bond and equity investors. We think the economy will eventually hit its stride, notwithstanding unforeseen global shocks. Hitting that stride may not come until the Fed’s rate hiking campaign is closer to its end, but we expect stock investors to benefit once it does.
Higher interest rates are challenging stock valuations and perhaps pushing the gains further out in 2023, but we still see solid potential for double-digit returns for stocks this year. The LPL Research Strategic and Tactical Asset Allocation Committee (STAAC) recommends a slight overweight allocation to equities, favors value over growth, small caps over large caps, and the energy, healthcare, and industrials sectors.
https://www.rwmfinancialgroup.com/wp-content/uploads/2023/01/weekly-market-commentary-december-12.png450450R.W.M. Financial Grouphttps://www.rwmfinancialgroup.com/wp-content/uploads/2022/09/RWM_Brand-Identity_RGB_Wordmark_Color-1030x883.pngR.W.M. Financial Group2023-03-06 11:06:412023-03-06 11:06:45No Landing. No Sense: Suggesting an Economy Makes “No Landing” Makes No Sense
While concerns about the debt ceiling have been increasing, markets, businesses, and the economy are likely to see only minimal impact until we are days, or maybe a few weeks, from the “x date,” the date on which the federal government will no longer be able to meet all its obligations, likely in the summer or early fall. We continue to believe the chances that Congress will fail to raise the debt ceiling before the x date remain extremely low, but current political dynamics have likely increased the risk and there are some negative consequences to even an eleventh-hour agreement, as we saw in 2011.
Debt ceiling drama is once again increasing, but the build-up will be slow. The Department of the Treasury (Treasury) has been using “extraordinary measures” to cover debt payments since January 19, but that has not been an unusual course of action and does not impact the government’s ability to function smoothly. Markets, businesses, and the economy are likely to see only minimal impact from the debt ceiling debate until we are days, or maybe a few weeks, from the “x date,” the date on which the federal government will no longer be able to meet all its obligations. That date will likely be in the summer or early fall, depending on tax receipts and other factors.
We continue to believe the likelihood the debt ceiling won’t be raised in time remains extremely low. Nevertheless, uncertainty about whether it will be raised can have its cost. We believe those costs are currently near negligible and will build slowly. Risks will increase more quickly if we are several weeks away from the x date and still appear to be at a deep political impasse. The mere appearance of Democrats and Republicans playing politics near the deadline can weigh on markets and force businesses to start preparing for the very unlikely, but still possible, outcome of a government default. The current political dynamics, with a split Congress and a thin majority in both the House and Senate, have likely increased the overall risk and there are some negative consequences to even an eleventh-hour agreement, as we saw in 2011.
U.S. Debt Ceiling Questions Answered
1. What is the debt ceiling?
The debt ceiling is the limit on how much the federal government can borrow. Unlike every other democratic country (except Denmark), a limit on borrowing is set by statute in the U.S., which means Congress must raise the debt ceiling for additional borrowing to take place.
2. Why does the U.S. do it differently?
The debt ceiling was originally created to make borrowing easier by unifying a sprawling process for issuing debt to help fund U.S. participation in World War I. The process was further streamlined to help fund participation in World War II, creating the debt ceiling process that is in use today. According to the Constitution, Congress is responsible for authorizing debt issuance, but there are many potential mechanisms that could make the process smoother.
3. Why is it important to raise the debt ceiling?
The government uses a combination of revenue, mostly through taxes, and additional borrowing to pay its current bills—including Social Security, Medicare, and military salaries—as well as the interest and principal on outstanding debt. If the debt ceiling isn’t raised, the government will not meet all its current obligations and could default.
4. Has Congress always raised the debt ceiling?
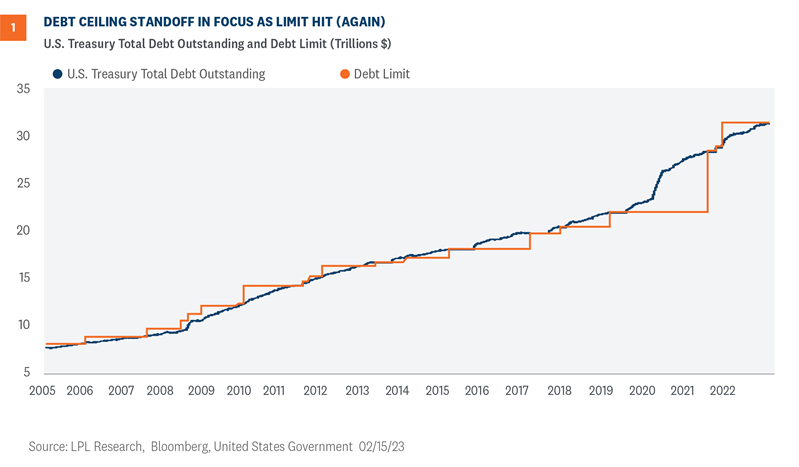
Yes, whenever needed. According to the Treasury, since 1960 Congress has raised the debt ceiling in some form 78 times, 49 times under Republican presidents and 29 times under Democratic presidents. As shown in Figure 1, Congress has regularly raised the debt ceiling as needed. In fact, every president since Herbert Hoover has seen the debt ceiling raised or suspended during their administration.
5. Is the debt ceiling being raised to cover potential new spending programs?
No. Lifting the debt ceiling does not authorize any new spending. The debt ceiling needs to be raised to meet current obligations already authorized by Congress. Theoretically, not raising the debt ceiling would limit spending in the future, but only by deeply undermining the basic ability of the government to function, including funding the military, mailing out Social Security payments, and making interest and principal payments on its current debt.
While perhaps symbolic of excessive spending, the debt ceiling is not the appropriate instrument to limit spending. Spending responsibility sits with Congress and the president, but Democrats and Republicans have both favored deficit-financed spending once in power. Bill Clinton’s presidency, much of it with a Republican Congress, was the only one that saw the publicly held national debt decline since Calvin Coolidge in the 1920s.
6. When was the debt ceiling last raised?
The debt ceiling was last raised in December 2021. No Republicans voted for that increase, but some Republicans did vote to suspend the Senate filibuster so the increase could be passed with a simple majority.
7. If we were at the debt ceiling on January 19 and nothing happened, why is there a problem?
When we hit the debt ceiling, the Treasury is authorized to use “extraordinary measures” that allow the government to continue to temporarily meet its obligations, including suspending Treasury reinvestment in some retirement-related funds for government employees. But the additional funding available through these measures is limited.
8. What’s the actual deadline?
The real deadline, also called the “x date” is hard to pinpoint because it depends on revenue and payments that are variable as we approach the date. The level of tax revenue around the federal income tax filing date is particularly important. The window right now is wide, probably summer to early fall, but that does mean there are circumstances where the actual x date could be early summer.
9. Who typically wins debt ceiling battles?
Independent of anyone’s view on the level of government spending, a timely increase in the debt ceiling eliminates the risk of unnecessary turmoil for markets, businesses, and the economy. As for who wins the battle politically, we leave that for voters to decide for themselves.
10. What would the Treasury have to do if Congress failed to act in time?
Without the ability to issue new debt to pay existing claims, the Treasury would have to rely on current cash on hand (and incoming cash) to make its payments. So, the Treasury would be able to make some payments—just not all of them. As such, the Treasury department would likely have to prioritize its payments. Moreover, the longer the delay in raising/suspending the debt ceiling, the harder it may be for Treasury to make its payments.
In 2011 and again in 2013, Federal Reserve and Treasury officials developed a plan in case the debt ceiling wasn’t addressed in time. At that time, they determined the “best” course of action would be to prioritize debt payments over payments to households, businesses, and state governments. By prioritizing Treasury debt obligations it was assumed the financial repercussions would be minimized. However, given comments by rating agencies (more on this below), there’s no guarantee that prioritizing debt payments would stave off severe, longer-term consequences like a debt downgrade or higher borrowing costs. Nonetheless, in order to adhere to the full faith and credit clause within the Constitution, debt servicing costs would likely be prioritized.
There is the possibility that prioritizing debt service would be challenged in court. Even if there’s a strong case to be made, we think debt service prioritization would be allowed to continue while the case works its way through the courts, since the potential economic damage would be too great otherwise. Even in the very unlikely event that Congress fails to raise the debt ceiling, the political and economic fallout would potentially be so swift that we would expect it to be raised in days rather than weeks or months, making the question of whether debt payments could be prioritized a moot point.
11. U.S. Treasury debt was downgraded in August 2011 because Congress waited until the last minute to raise the debt ceiling. Could we see additional rating changes this time?
In 2011, even though Congress acted before the x date, one of the three main rating agencies, S&P, downgraded U.S. Treasury debt one notch from AAA to AA+. While the other two main rating agencies retained the U.S. AAA rating, they both downgraded the outlook to negative. S&P has maintained that AA+ rating since 2011.
Now, all three rating agencies have publicly stated that they are confident a deal will get done. However, one of the three, Fitch, has threatened to downgrade U.S. debt if the debt ceiling isn’t raised or suspended in time. Further, Fitch has stated that prioritization of debt payments would lead to non-payment or delayed payment of other obligations and “that would not be consistent with an AAA rating.” So even if Treasury made debt payments on time, missing other payments would likely result in a rating downgrade. It is likely other rating agencies would follow suit as well. Another rating downgrade by a major rating agency would likely call into question use of Treasury securities as risk-free assets, which would have major financial implications globally.
12. Could failure to address the debt ceiling push the economy into a recession?
It would depend on how long Treasury would have to prioritize payments. If the delay is only a day or two, then it is unlikely the economy would slow enough to actually enter into a recession. Payments that were deferred would be repaid in arrears so the economic impact would likely be minimal.
However, in the very unlikely event that payment prioritization is necessary over a prolonged period of time—say a month or longer—this could indeed cause economic activity to contract. Since the government is running a fiscal deficit, and since Treasury cannot issue debt to cover that deficit, spending cuts would need to take place. The spending cuts, if prolonged, would likely push the U.S. economy into recession. Moreover, the unknown knock-on effects such as the impact on business confidence would also likely slow economic growth. Since the situation would be unprecedented, it’s very difficult to estimate the impact. Moody’s has said that based on their modeling, “the economic downturn ensuing from a political impasse lasting even a few weeks would be comparable to that suffered during the global financial crisis” (Moody’s Analytics, “Debt Limit Brinksmanship,” 6).
13. How would a technical default impact the financial markets?
In 2011, the S&P 500 fell by over 16% in the span of 21 days due to the debt ceiling debate and subsequent rating downgrade. The equity market ended the year roughly flat so investors who were able to invest after that large drawdown were rewarded. However, that large drawdown was due solely to the policy mistake of not raising the debt ceiling in a timely manner. It’s likely that if Congress were to wait until the last minute in raising/suspending the debt ceiling, equity markets would react similarly.
Perhaps counterintuitively, despite the prospects of delayed payments and the debt downgrade, intermediate and longer-term Treasury yields fell/prices increased as they are generally considered to be a “safe-haven” asset. And while that may have been the market reaction in 2011, there is no guarantee that in the event of a technical default and further rating downgrades Treasury securities would have a positive return this time around, particularly if Treasury securities lose their status as the risk-free rate.
Conclusion
Given the experience from 2011, we think it would be prudent for Congress to raise the debt ceiling reasonably in advance of the date when the government would no longer be able to meet all its obligations. Political brinksmanship with the debt ceiling is a dangerous game, with likely relatively little to gain and much to lose. At the same time, we don’t think that should hinder conversations about controlling spending. The debt ceiling simply isn’t the place for that conversation to take place.
Barry Gilbert, PhD, CFA, Asset Allocation Strategist, LPL Financial
Lawrence Gillum, CFA, Fixed Income Strategist, LPL Financial
https://www.rwmfinancialgroup.com/wp-content/uploads/2023/01/weekly-market-commentary-december-12.png450450R.W.M. Financial Grouphttps://www.rwmfinancialgroup.com/wp-content/uploads/2022/09/RWM_Brand-Identity_RGB_Wordmark_Color-1030x883.pngR.W.M. Financial Group2023-02-27 09:25:272023-02-27 09:25:31Debt Ceiling Primer: What You Need to Know
Markets have adjusted to several changes this year. The pace at which inflation has cooled is slowing. The market has started to believe the Federal Reserve’s (Fed) “higher for longer” message. The bar for earnings has been lowered. Market relationships to interest rates have been turned upside down. And many of last year’s losers are this year’s winners and vice versa. Here we take a look at some of the biggest changes in the market environment so far in 2023 and what those changes could mean for investors over the balance of the year.
The Fed’s Message Is Getting Through As Markets Recalibrate
Coming into 2023, markets had been pricing in two 25 basis point (0.25%) interest rate hikes, one in February and the second one at the next Fed meeting on March 21-22. In addition, there were expectations of an interest rate cut at the end of the year. All macro-economic indications suggested that with inflationary pressures easing, the Fed would be moving closer to its final “terminal” rate by the second half of the year. The only question was would the Fed stay on hold throughout 2023 before lowering rates in 2024, as suggested by a consensus of Fed members.
However, recent data releases, including the Consumer Price Index (CPI), Producer Price Index (PPI), and retail sales, showed inflation inching higher and a consumer still spending at a healthy pace. Even amid weak housing data for January, homebuilder sentiment improved nicely and exceeded expectations. Factoring in all of the data releases, including disappointing industrial production figures, the Atlanta Fed’s GDPNow real-time tracker of gross domestic product inched higher to a solid 2.5% for the first quarter.
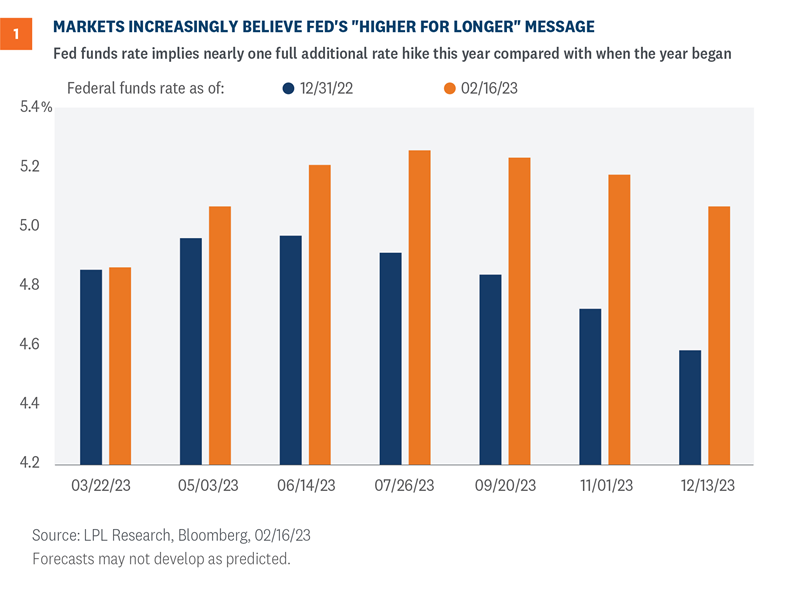
The fed funds futures market quickly adjusted probabilities as well, pricing in a potential third interest rate hike at the Fed’s June meeting. What has caught the market’s attention, however, is the slight probability for a 50 basis point rate hike at the March meeting has been climbing higher, as two non-voting members of the Federal Open Market Committee (FOMC), Loretta Mester and James Bullard, made comments suggesting a 50 basis point rate hike in March may be necessary to help tackle inflation. Markets are listening, which you can clearly see in the change in market-implied Fed rate targets for this year (Figure 1).
Important data releases before the March 21-22 meeting will help underpin the Fed’s monetary policy trajectory. The February 24 release of the Fed’s preferred inflation index, the Personal Consumption Expenditures Price Index (PCE), will be especially important in forecasting the Fed’s next policy decision.
Similarly, comments from Fed officials will also help guide markets regarding the Fed’s thinking regarding its rate hike campaign.
Earnings Bar Has Been Lowered Substantially
A difficult fourth quarter earnings season is entering the home stretch, and overall the numbers have been lackluster. S&P 500 earnings per share (EPS) for the quarter are tracking to a roughly 4% year-over-year decline, slightly below estimates at year end. Slower economic growth, cost pressures from higher inflation, and ongoing adjustments from excess pandemic-related spending have combined to create an especially challenging earnings environment. The end result will be the first year-over-year earnings decline since the third quarter of 2020.
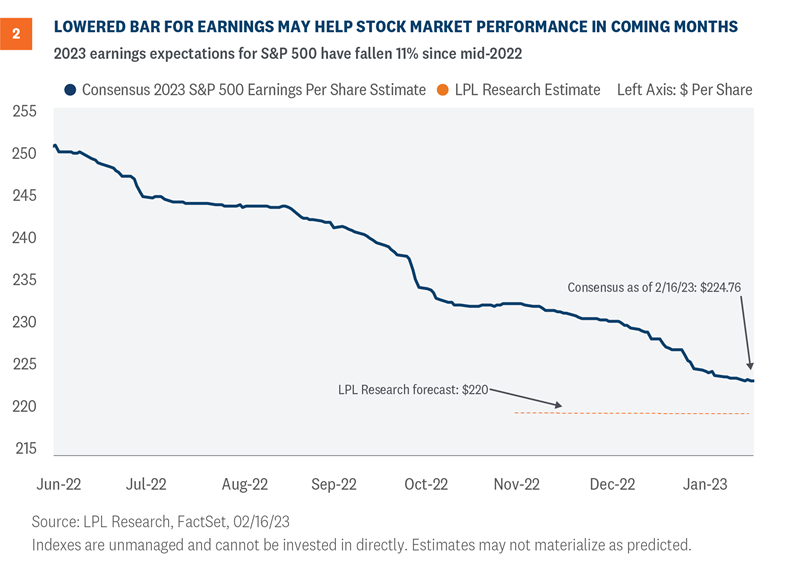
Despite lackluster overall results, we see a silver lining amid the sea of red numbers. Earnings estimates for 2023 have been widely considered to be too high based on historical earnings declines in recessions. The consensus estimate for S&P 500 earnings this year has come down 3% since the year began, lowering the bar. Earnings estimates have not collapsed, but corporate America has sure brought expectations down (Figure 2). Cautious guidance has made estimates more realistic.
It’s difficult for stocks to sustain moves higher as estimates are coming down. However, we believe lowering the bar sets up potential gains for stocks later this year as estimates stabilize, or potentially even start moving higher, and earnings growth resumes.
Shifting Relationship Between Stocks and Interest Rates
Much has been written about how the laggards of 2022 have been the winners of 2023. Value stocks held up much better than growth stocks last year, and this year growth is leading. Last year’s worst performing sectors, consumer discretionary, communication services, and technology, are this year’s top performers, each with double-digit year-to-date-percentage gains. At the individual stock level, the reversal is stark. The 50 worst performing stocks of 2022 have gained an average of 21.8% year to date.
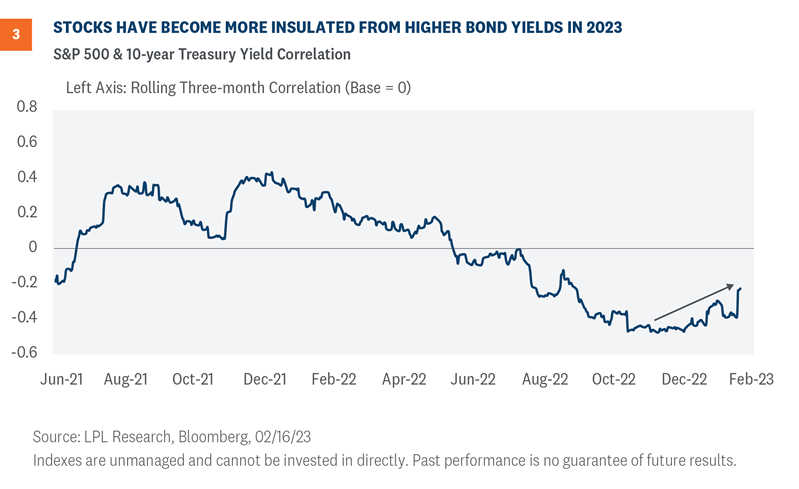
Here we focus on the interest rate relationship. Last year, stocks and yields moved mostly in opposite directions. When inflation expectations and interest rates moved higher, stocks tended to sell off and vice versa. But we have seen this relationship change recently, as stocks and yields have risen together. Specifically, since January 25, the 10-year Treasury yield has risen roughly 50 basis points while the S&P 500 has gained 2%. That’s not much, but as Figure 3 shows, it suggests a more resilient equity market in the face of higher-than-expected inflation data. Last year, the market response to pricing in more Fed rate hikes would have been much more negative.
We don’t know if this dynamic will be sustained, but we view it as a positive step toward exiting the bear market that increases the chances of a rewarding 2023 for investors.
What does it mean?
We see several implications from these changes in the economic and market environment:
More volatility in the near term. First, though this may be obvious, markets may be bumpy in the coming weeks and months because it will take more time to fully price in the end of the Fed rate hiking cycle. Market-based interest rates, such as the 10-year Treasury, may go higher than we anticipated when the year began, potentially putting pressure on stock valuations. That makes our bull case for stocks (S&P 500 to 5,100) in Outlook 2023: Finding Balanceless likely than our original odds of 25% and increases the chances that stocks miss our base case scenario target (4,320) from that publication.
Possible barbell year. The lowered bar for earnings should help stocks over the balance of the year, though that benefit may not come until the fall. We could envision a scenario where estimates dip below our forecast before upside late in the year gives earnings—and stock prices—a lift. That means we could see a solid start for stocks and a solid finish, with weakness in between.
Don’t chase high growth. We would be careful not to chase the most growth-oriented sectors of the market after such a strong start to the year. Near-term risk of higher interest rates is increasing, and these areas do tend to be interest rate sensitive. Value-style stocks are trading at well above-average valuation discounts to their growth counterparts despite the strong 2022 and have historically performed better in inflationary, higher interest rate environments (a topic we discussed here). Energy and industrials look like particularly fertile ground to find investment opportunities.
In conclusion, while these takeaways may not sound particularly bullish at the moment, we would not discount the chances of a soft landing (as we wrote about here last week). The elevated producer price index (PPI) reading last week was disappointing, but it was paired with a solid retail sales report and low jobless claims numbers that tell us the outlook for consumer spending remains healthy. The path to low double-digit gains for stocks this year has narrowed some, but it still looks passable.
Quincy Krosby, PhD, Chief Global Strategist, LPL Financial
https://www.rwmfinancialgroup.com/wp-content/uploads/2023/01/weekly-market-commentary-december-12.png450450R.W.M. Financial Grouphttps://www.rwmfinancialgroup.com/wp-content/uploads/2022/09/RWM_Brand-Identity_RGB_Wordmark_Color-1030x883.pngR.W.M. Financial Group2023-02-21 09:24:462023-02-21 09:24:50What’s Changed in the Markets in 2023 and What it Could Mean
We may request cookies to be set on your device. We use cookies to let us know when you visit our websites, how you interact with us, to enrich your user experience, and to customize your relationship with our website.
Click on the different category headings to find out more. You can also change some of your preferences. Note that blocking some types of cookies may impact your experience on our websites and the services we are able to offer.
Essential Website Cookies
These cookies are strictly necessary to provide you with services available through our website and to use some of its features.
Because these cookies are strictly necessary to deliver the website, refusing them will have impact how our site functions. You always can block or delete cookies by changing your browser settings and force blocking all cookies on this website. But this will always prompt you to accept/refuse cookies when revisiting our site.
We fully respect if you want to refuse cookies but to avoid asking you again and again kindly allow us to store a cookie for that. You are free to opt out any time or opt in for other cookies to get a better experience. If you refuse cookies we will remove all set cookies in our domain.
We provide you with a list of stored cookies on your computer in our domain so you can check what we stored. Due to security reasons we are not able to show or modify cookies from other domains. You can check these in your browser security settings.
Google Analytics Cookies
These cookies collect information that is used either in aggregate form to help us understand how our website is being used or how effective our marketing campaigns are, or to help us customize our website and application for you in order to enhance your experience.
If you do not want that we track your visit to our site you can disable tracking in your browser here:
Other external services
We also use different external services like Google Webfonts, Google Maps, and external Video providers. Since these providers may collect personal data like your IP address we allow you to block them here. Please be aware that this might heavily reduce the functionality and appearance of our site. Changes will take effect once you reload the page.
Google Webfont Settings:
Google Map Settings:
Google reCaptcha Settings:
Vimeo and Youtube video embeds:
Other cookies
The following cookies are also needed - You can choose if you want to allow them:
Privacy Policy
You can read about our cookies and privacy settings in detail on our Privacy Policy Page.