
How Much of a Problem is Concentrated Leadership for Stocks?
The mega-cap technology companies have powered the broad market higher this year. In fact, the 8.1% gain in the S&P 500 year to date has been driven entirely by six mega-cap stocks: Apple (AAPL), Microsoft (MSFT), NVIDIA (NVDA), Meta (META), Amazon (AMZN), and Alphabet (GOOG/L). Is this narrow leadership a problem for stocks looking forward? We try to answer that question below.
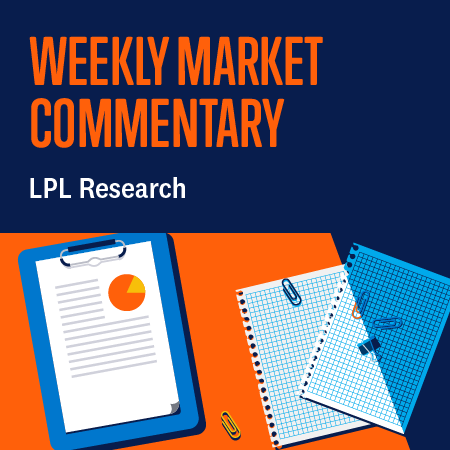
The Generals Lead
Mega-cap stocks, which have outlier market capitalizations and are often referred to as ‘the generals,’ have made an impressive comeback this year. Last year’s headwinds of higher rates underpinned by aggressive Federal Reserve (Fed) tightening have finally abated. Interest rate stabilization, signs of receding inflation, and a potential peak in the terminal rate by this summer have helped bring buyers back into the space. Rising recession odds in the U.S. have further increased the relative attractiveness of mega-caps, as investors have shown a growing propensity for higher quality, well-established companies with sustainable growth profiles and fortress balance sheets.
The rising popularity of artificial intelligence (AI) has been another major catalyst driving outperformance this year, as most of the generals are linked by varying degrees to the AI industry. Chipmaker NVIDIA (NVDA), a leader in AI who manufactures graphics processing units and other AI-related hardware and software, is up 160% year to date, including a 24% earnings-driven rally on May 25. As shown in Figure 1, the company has contributed nearly 21% to the S&P 500’s 8.1% year-to-date gain, despite the company representing only around a 2.7% index weight. Without NVDA or the rest of the generals (AAPL, MSFT, GOOG/L, AMZN, and META), the S&P 500 would be down 0.3% this year.
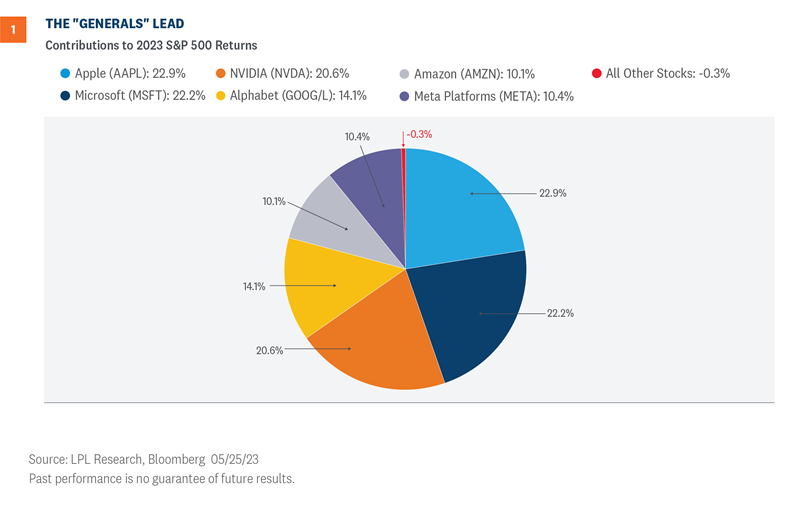
Bad Breadth
Narrow market leadership has been a major theme this year and is considered by many investors as a missing piece of the recovery puzzle. Less than half of the stocks comprising the S&P 500 are trading above their 200-day moving average (dma), while only around a quarter are outperforming the index year to date (Figure 2). Furthermore, these percentages have declined over the last several weeks, forming a bearish divergence between price and market breadth.
In a typical bull market or even a developing one, widespread participation provides confirmation of the uptrend’s strength and sustainability. When participation in the advance is limited—as is the case for 2023 thus far—vulnerabilities emerge as the weight of the market’s advance falls on the shoulders of a limited number of stocks. The lack of broad-based buying across equity markets also points to potentially limited investment opportunities and a lack of conviction among investors. Both of these attributes are likely impacting breadth this year as higher yields in the fixed income market raise the bar for capital crossing back over into equities.
While the fact that only six stocks are driving the S&P 500’s advance this year is concerning, taking a look underneath the hood shows a few sector bright spots that could keep the market moving forward along the road of recovery. Over half of the stocks within the communication services, consumer discretionary, and technology sectors are trading above their 200-dma, implying the majority of stocks within these sectors check the box for the basic definition of an uptrend. Furthermore, over 40% of the stocks in each sector are outperforming the S&P 500 this year. Collectively, these sectors represent around 46% of the S&P 500 and may provide enough support for the market to sustain its current uptrend.
What Does Bad Breadth Mean for Returns?
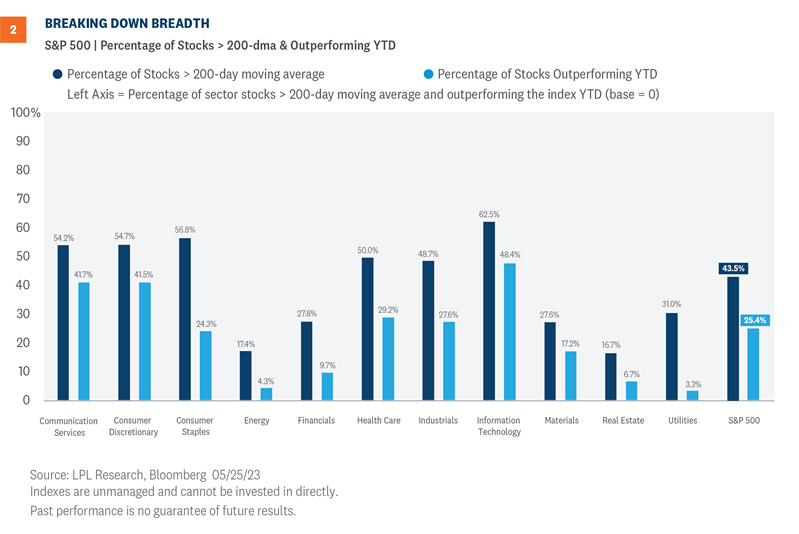
In order to help quantify the importance of market breadth, we broke down the percentage of S&P 500 stocks trading above their 200-dma into quintiles across a time series of data going back to 1991. The quintiles split the breadth readings of stocks above their 200-dma into five equal portions across the dataset. For example, the top, or first, quintile represents the highest 20% of breadth readings during this timeframe, while the fifth quintile represents the lowest 20% of breadth readings. After filtering the breadth percentages into quintiles, we then calculated forward returns for each trading day across the quintile groups.
As Figure 3 shows, market breadth has been a statistically strong indicator for future S&P 500 performance. The top quintile group, classified as periods when 81% or more of S&P 500 stocks were trading above their 200-dma, has notably outperformed the lower quintile groups along with the average S&P 500 returns across all periods during this timeframe. Unfortunately, the S&P 500 currently falls into the fifth quintile group as only 44% of constituents are above their 200-dma. Returns in this group have historically been negative over the following 12 months. This data further supports our thesis that broader participation will be required for the S&P 500 to have a sustainable breakout above key resistance at 4,200.
Strong Starts Often Followed by Solid Finishes: A Look at the First 100 Days
Bullish momentum and positive seasonality trends could help improve the narrow breadth backdrop. Thursday, May 25, was the 100th trading day of 2023, prompting us to ask what the market’s strong performance so far could mean for the rest of the year. Through that 100th trading day (about 40% of the way through the year), the S&P 500 gained a solid 8.1% (excluding dividends). If we look at similarly strong starts to years—we use 7% gains as the hurdle—the average gain the rest of the year has been quite strong at 9.4% (Figure 4). That compares to the average gain of 5.4% in all years from trading day #101 through year-end, on top of an average first 100-day performance in all years since 1950 of 3.4%.
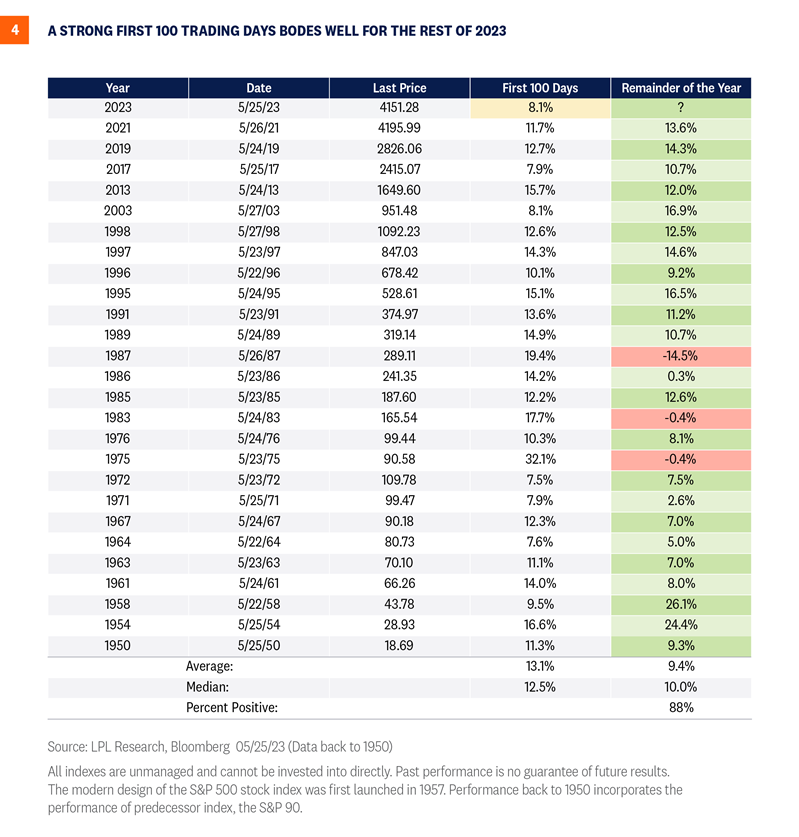
The consistency of these strong finishes is also impressive. After these strong starts, the S&P 500 has added to those gains in 23 of 26 years (88%). As shown in Figure 4, two of the three years when stocks fell after the strong first 100 days ended only marginally lower—the S&P 500 fell just 0.4% the rest of the year in 1975 and 1983. That means only 1987 saw stocks experience a material decline after a strong start, which encompasses the Black Monday crash in October of that year. While we know there are no guarantees in this business, the consistency of this pattern over seven decades suggests it may very well hold up again.
Investment Outlook
There are a number of reasons to think stocks can end the year higher than where they are now. The tendency for stocks to build on gains after a strong first 100 days is one of them. Another, which NVIDIA highlighted last week, is that the earnings power of corporate America is greater than the market had previously anticipated, which could help support stocks in the weeks ahead, particularly if the timetable for a potential, likely mild, recession continues to get pushed out.
We still have risks of course. There’s the narrow market leadership highlighted in this commentary and the difficulty the S&P 500 has had breaking through the 4,200 resistance level. It looks like the debt ceiling debacle is almost behind us, though the additional resulting debt could put some upward pressure on short-term interest rates in the near term. Though regional bank stress appears contained for now, the commercial real estate challenges aren’t going away soon. And don’t break out your Fed pause champagne just yet because Friday’s still-stubbornly-high inflation data keeps a Fed rate hike next month on the table even if our odds still slightly favor a pause with some tough talk.
Latest Thoughts on Tactical Asset Allocation
The LPL Research Strategic and Tactical Asset Allocation Committee (STAAC) recommends a slight overweight allocation to equities, but with the risk-reward trade-off looking more neutral at this point, and higher interest rates offering more yield on the fixed income side, the Committee’s conviction on the equities overweight view has started to wane some.
The STAAC has squared up its views on growth and value, favors large caps over small, and maintains the industrials sector as the top overall sector pick, with communication services and technology as top ideas based on technical analysis.
Within fixed income, the STAAC recommends an up-in-quality approach with a benchmark weight to duration. We think core bond sectors (U.S. Treasuries, Agency mortgage-backed securities (MBS), and short-maturity investment grade corporates) are currently more attractive than plus sectors (high-yield bonds and non-U.S. sectors) with the exception of preferred securities, which look attractive after having recently sold off due to the banking stresses.
Adam Turnquist, CMT, Chief Technical Strategist, LPL Financial
Jeffrey Buchbinder, CFA, Chief Equity Strategist, LPL Financial

