
Closing Out Our Equities Overweight
Stocks have had a nice run, but at higher prices, the bar for further gains gets higher. We have recently made the case in this publication that there are a lot of reasons to expect the market to go higher between now and year-end. But with stocks at higher valuations, high-quality bonds offering attractive yields, an S&P 500 Index with concentrated leadership facing technical resistance at 4,300, and an elevated risk of a late-2023 recession, we think it makes sense to be a bit careful here. Importantly, though, neutral is not bearish.
Five reasons we’re lowering our equities allocation
There are five primary reasons why the LPL Research Strategic and Tactical Asset Allocation Committee (STAAC) is lowering its recommended equities allocation to neutral today.
Reason #1: Recession Is Likely by Year End
Our base case is for the economy to slip into a mild recession by the end of 2023. However, the solid labor market and elevated surplus savings are delaying the onset of a broad-based contraction. Despite Friday’s strong jobs report, cracks are appearing. The latest Federal Reserve (Fed) Beige Book revealed a recession already started in the trucking and freight industries, and perhaps this is a leading indicator of a broader slowdown in business activity in the months ahead.
If and when a recession begins, the impact on capital markets will likely be mixed since some sectors could skirt the full impact of an economic contraction as upper-income households release pent-up demand for experiences within the services economy. The average loss for the S&P 500 during the six months before a recession has been 1.4% historically, based on data since 1970, though the index did gain nearly 10% ahead of the 1980 and 1990 recessions.
Reason #2: The S&P 500 Is Facing Strong Technical Resistance
The technical setup for the S&P 500 is a story of the good, the bad, and the ugly. The good news is that the market remains in an uptrend and above its rising 50- and 200-day moving averages (dma). Furthermore, after several failed attempts, the index finally surpassed resistance at 4,200 (Figure 1).
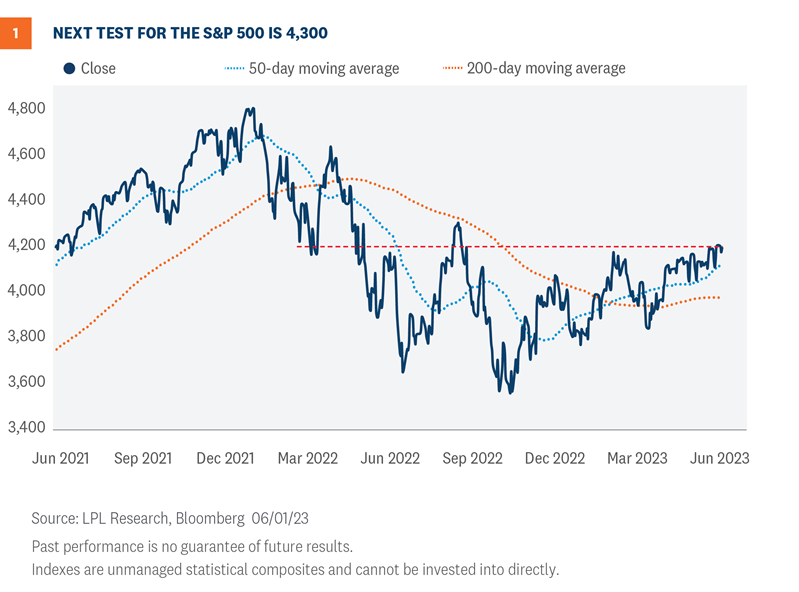
The bad news is that the next major area of resistance sets up near 4,300, which traces back to the August 2022 highs and lines up with a key retracement level of last year’s bear market. With major resistance coming into play only marginally above current S&P 500 levels, we believe the reward-to-risk profile has become less attractive.
Diverging market breadth represents the ugly portion of the technical story. Fewer and fewer stocks are participating in the latest advance, while leadership is highly concentrated in only a handful of mega-cap names. For example, only 43% of S&P 500 stocks are trading above their 200-dma, compared to 79% when the market notched its February high. On an equal weighted basis—meaning every stock in the index carries the same weighting—the S&P 500 is only 1.5% higher on the year, highlighting how much heavy lifting the mega-caps have done for the index’s 11.5% year-to-date advance (as of June 2).
In a typical bull market or even a developing one, widespread participation provides confirmation of the uptrend’s strength and sustainability. When participation in the advance is limited, vulnerabilities emerge as the weight of the market’s advance falls on the shoulders of a limited number of stocks.
Reason #3: Technology Is Overbought and Due for Consolidation
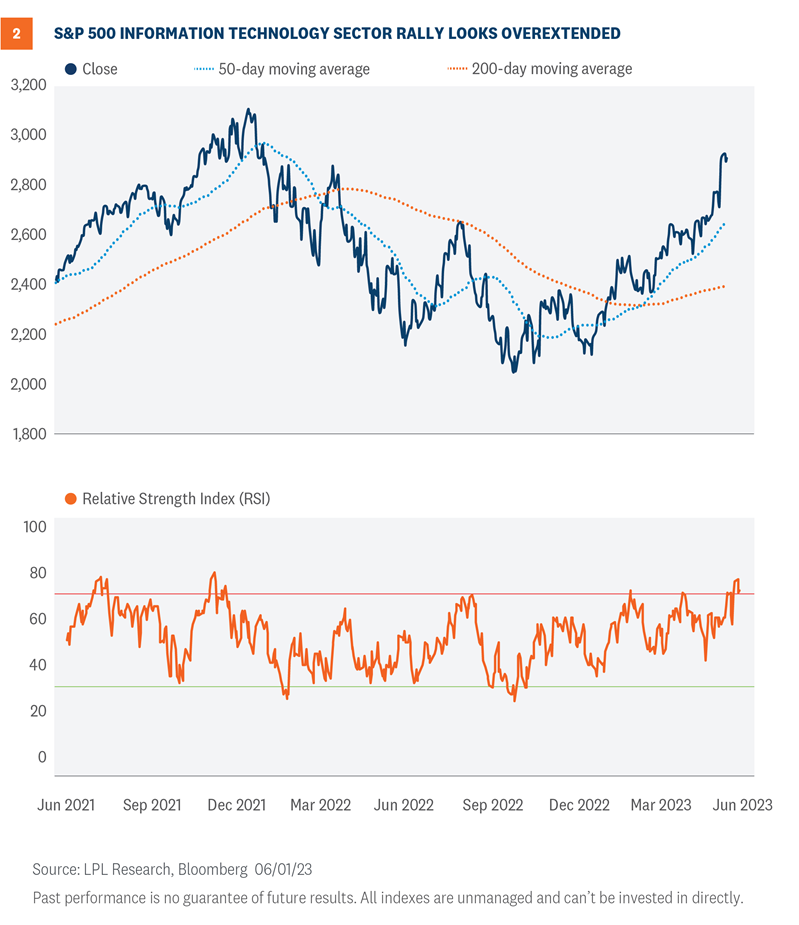
Technology has been the main engine behind this year’s rally, and risk of the sector overheating continues to climb. Since the April 2023 low, the sector has rallied 16% as of June 1, marking the highest rate of change over a 26-trading-day period since February. In fact, whenever the rate of change has crossed above 16% over an equivalent timeframe, the technology sector has historically declined by an average of 2.5% over the following three-month period.
Overbought conditions are also becoming widespread. The sector’s Relative Strength Index (RSI)—a momentum oscillator used to measure the speed and magnitude of price action—recently hit its highest overbought reading since December 2021. Furthermore, nearly 30% of technology sector stocks reported an overbought RSI reading last week.
While overbought conditions provide validation of the sector’s uptrend, and overbought does not mean over, the likelihood of a healthy consolidation and/or pullback appears to be rising. The good news is that if there is mean reversion, it would likely be toward the sector’s uptrend and provide a potential pullback opportunity for investors seeking a better entry point into the sector. In the event of a pullback, both the rising 20- and 50-dmas provide dynamic support levels to watch, along with the August highs near 2,650 (Figure 2).
Reason #4: Fixed Income Yields Are More Competitive With Equities
Higher interest rates make stocks relatively less attractive when compared with bonds for a couple of primary reasons. First, the value of a stock is the present value of future cash flows. So, a higher interest rate raises the discount rate and lowers the value of those cash flows.
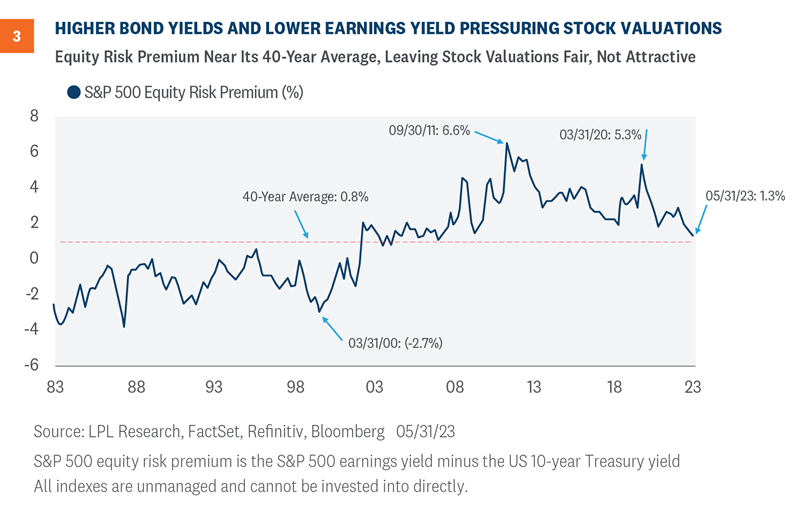
Second, higher interest rates also make bonds more attractive relative to stocks, all else equal. We use the equity risk premium (ERP) calculation shown in Figure 3 to compare the earnings from bonds (yield) to the earnings from stocks (earnings yield, or earnings divided by price). Based on the S&P 500 Index price and U.S. 10-Year Treasury yield as of May 31, the ERP is down to 1.3%, in line with the 40-year average and much richer than the near 3% ERP a year ago.
Friday’s strong jobs report increases the risk that interest rates move higher from current levels, as a potential July rate hike is back on the market’s radar. The increasing relative attractiveness of fixed income, coupled with fuller equity valuations, supported the STAAC’s decision to move to an overweight fixed income allocation and a neutral position on equities today.
Reason #5: Seasonal Headwinds
Don’t expect any seasonal tailwinds to help stocks this month. The S&P 500 has generated average and median price returns during June of 0.0% and 0.1%, respectively, making it the fourth worst-performing month since 1950 (Figure 4).
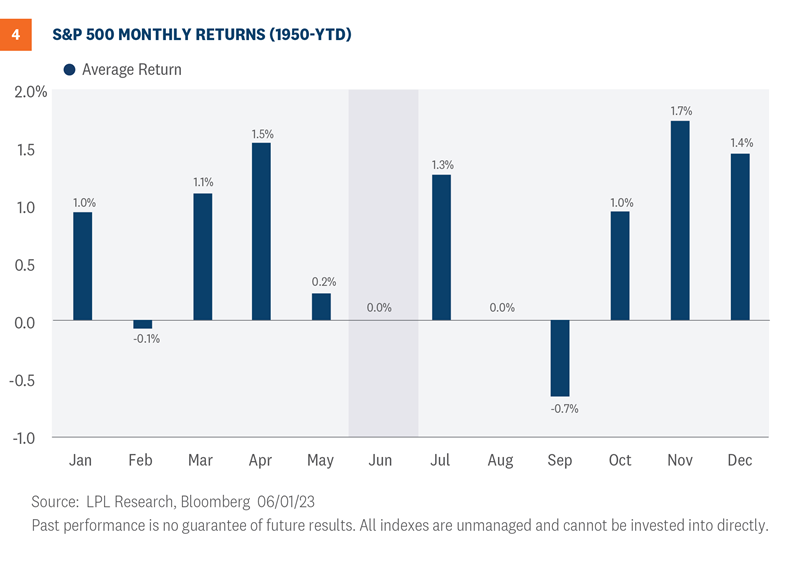
Furthermore, the index has only produced positive returns 54.8% of the time during June. For context, the S&P 500 has posted average monthly gains of 0.7% and finished positive 61% of the time for all months since 1950.
The seasonal setup for the technology sector in June is even worse. Since 1990, the sector has generated average and median price returns during the month of 0.0% and -1.7%, respectively, making it the second-worst month based on average returns and the worst month based on median returns. Furthermore, the tech sector has only produced positive returns 42.4% of the time during June, the lowest positivity rate across the calendar.
Risks to the upside
Although we think stocks are due for a pullback, or at least some choppiness, there are several upside risks. One we highlighted last week was the stock market’s strong performance historically after a solid first 100 trading days (discussed here).
Other potential risks to the upside include:
- The S&P 500 is still in a bear market (though barely), up 19.7% off its October 12, 2022 low, less than half the average gain one year after a bear market low of 42% since 1950 (the median gain is 34%). The technical definition of a bull market is a close 20% above the bear market low.
- Stocks are still in the favorable third year of the four-year Presidential cycle—the S&P 500 has gained an average of about 15% in the year after midterm elections (and is up 11.9% since midterms on November 8, 2022).
- After down years, as we had in 2022, the S&P 500 has historically gained an average of 15% in the subsequent year.
- Inflation continues to fall steadily, which could help economic growth, company profit margins, and stock valuations by lowering borrowing costs, input costs, and the discount rate used to value stocks.
- The end of the Fed’s rate hiking cycle could provide a tailwind for stocks. Historically, stocks have generated double-digit gains, on average, after the end of Fed rate hiking cycles, though in pre-1990 inflationary periods performance was more mixed.
- A case can be made that recession was already priced in last fall and that a new bull market is developing, potentially eliminating the need for the S&P 500 to return to the October lows as in a typical recession scenario. During bear markets accompanied by recession since 1950, stocks have always bottomed after the recession started.
Latest thoughts on asset allocation
The STAAC now recommends a neutral allocation to equities, with a modest overweight to fixed income funded from cash. The risk-reward trade-off between stocks and bonds looks relatively even to us, with core bonds providing a yield advantage over cash.
The STAAC recommends being neutral on style, favors developed international equities over emerging markets and large caps over small, and maintains the industrials sector as the top overall sector pick, with communication services and technology as top ideas based on technical analysis.
Within fixed income, the STAAC recommends an up-in-quality approach with a benchmark weight to duration. We think core bond sectors (U.S. Treasuries, Agency mortgage-backed securities (MBS), and short-maturity investment grade corporates) are currently more attractive than plus sectors (high-yield bonds and non-U.S. sectors) with the exception of preferred securities, which look attractive after having recently sold off due to the banking stresses.
Jeffrey Buchbinder, CFA, Chief Equity Strategist, LPL Financial
Adam Turnquist, CMT, Chief Technical Strategist, LPL Financial

