Soft landing or no soft landing, that is the question, with all due respect to William Shakespeare. But while this may be the most commonly asked question these days, it may not be the most important or the toughest. That honor goes to what’s priced in. Good market forecasts are not just about the economy and earnings—they are about what the market is pricing in. Below we share our thoughts on the potential for a soft landing, the possible role China might play in that, and whether markets are pricing in too much good news.

Strong Job Market Supports Case for Soft Landing

Recent economic and market data have reignited conversations about a potential soft landing. As we wrote in Midyear Outlook 2022: Navigating Turbulence, the ongoing economic recovery from the global pandemic required businesses and consumers to pilot the economy into a soft landing but that path would go through turbulence. As we subsequently developed Outlook 2023: Finding Balance, we thought the markets would be choppy as the world found its balance, while we waited for inflation to decelerate and central banks to ease up on their rate hiking campaigns.

So where are we in the business cycle? If you focus on jobs, the U.S. economy is headed toward a soft landing. Excluding the blowout report for January, average job gains were on a smooth downward trajectory (Figure 1). Minimal turbulence in the trend line is consistent with a pathway to a smooth landing. In fact, the blowout jobs report did not alter the Federal Reserve’s (Fed) playbook.
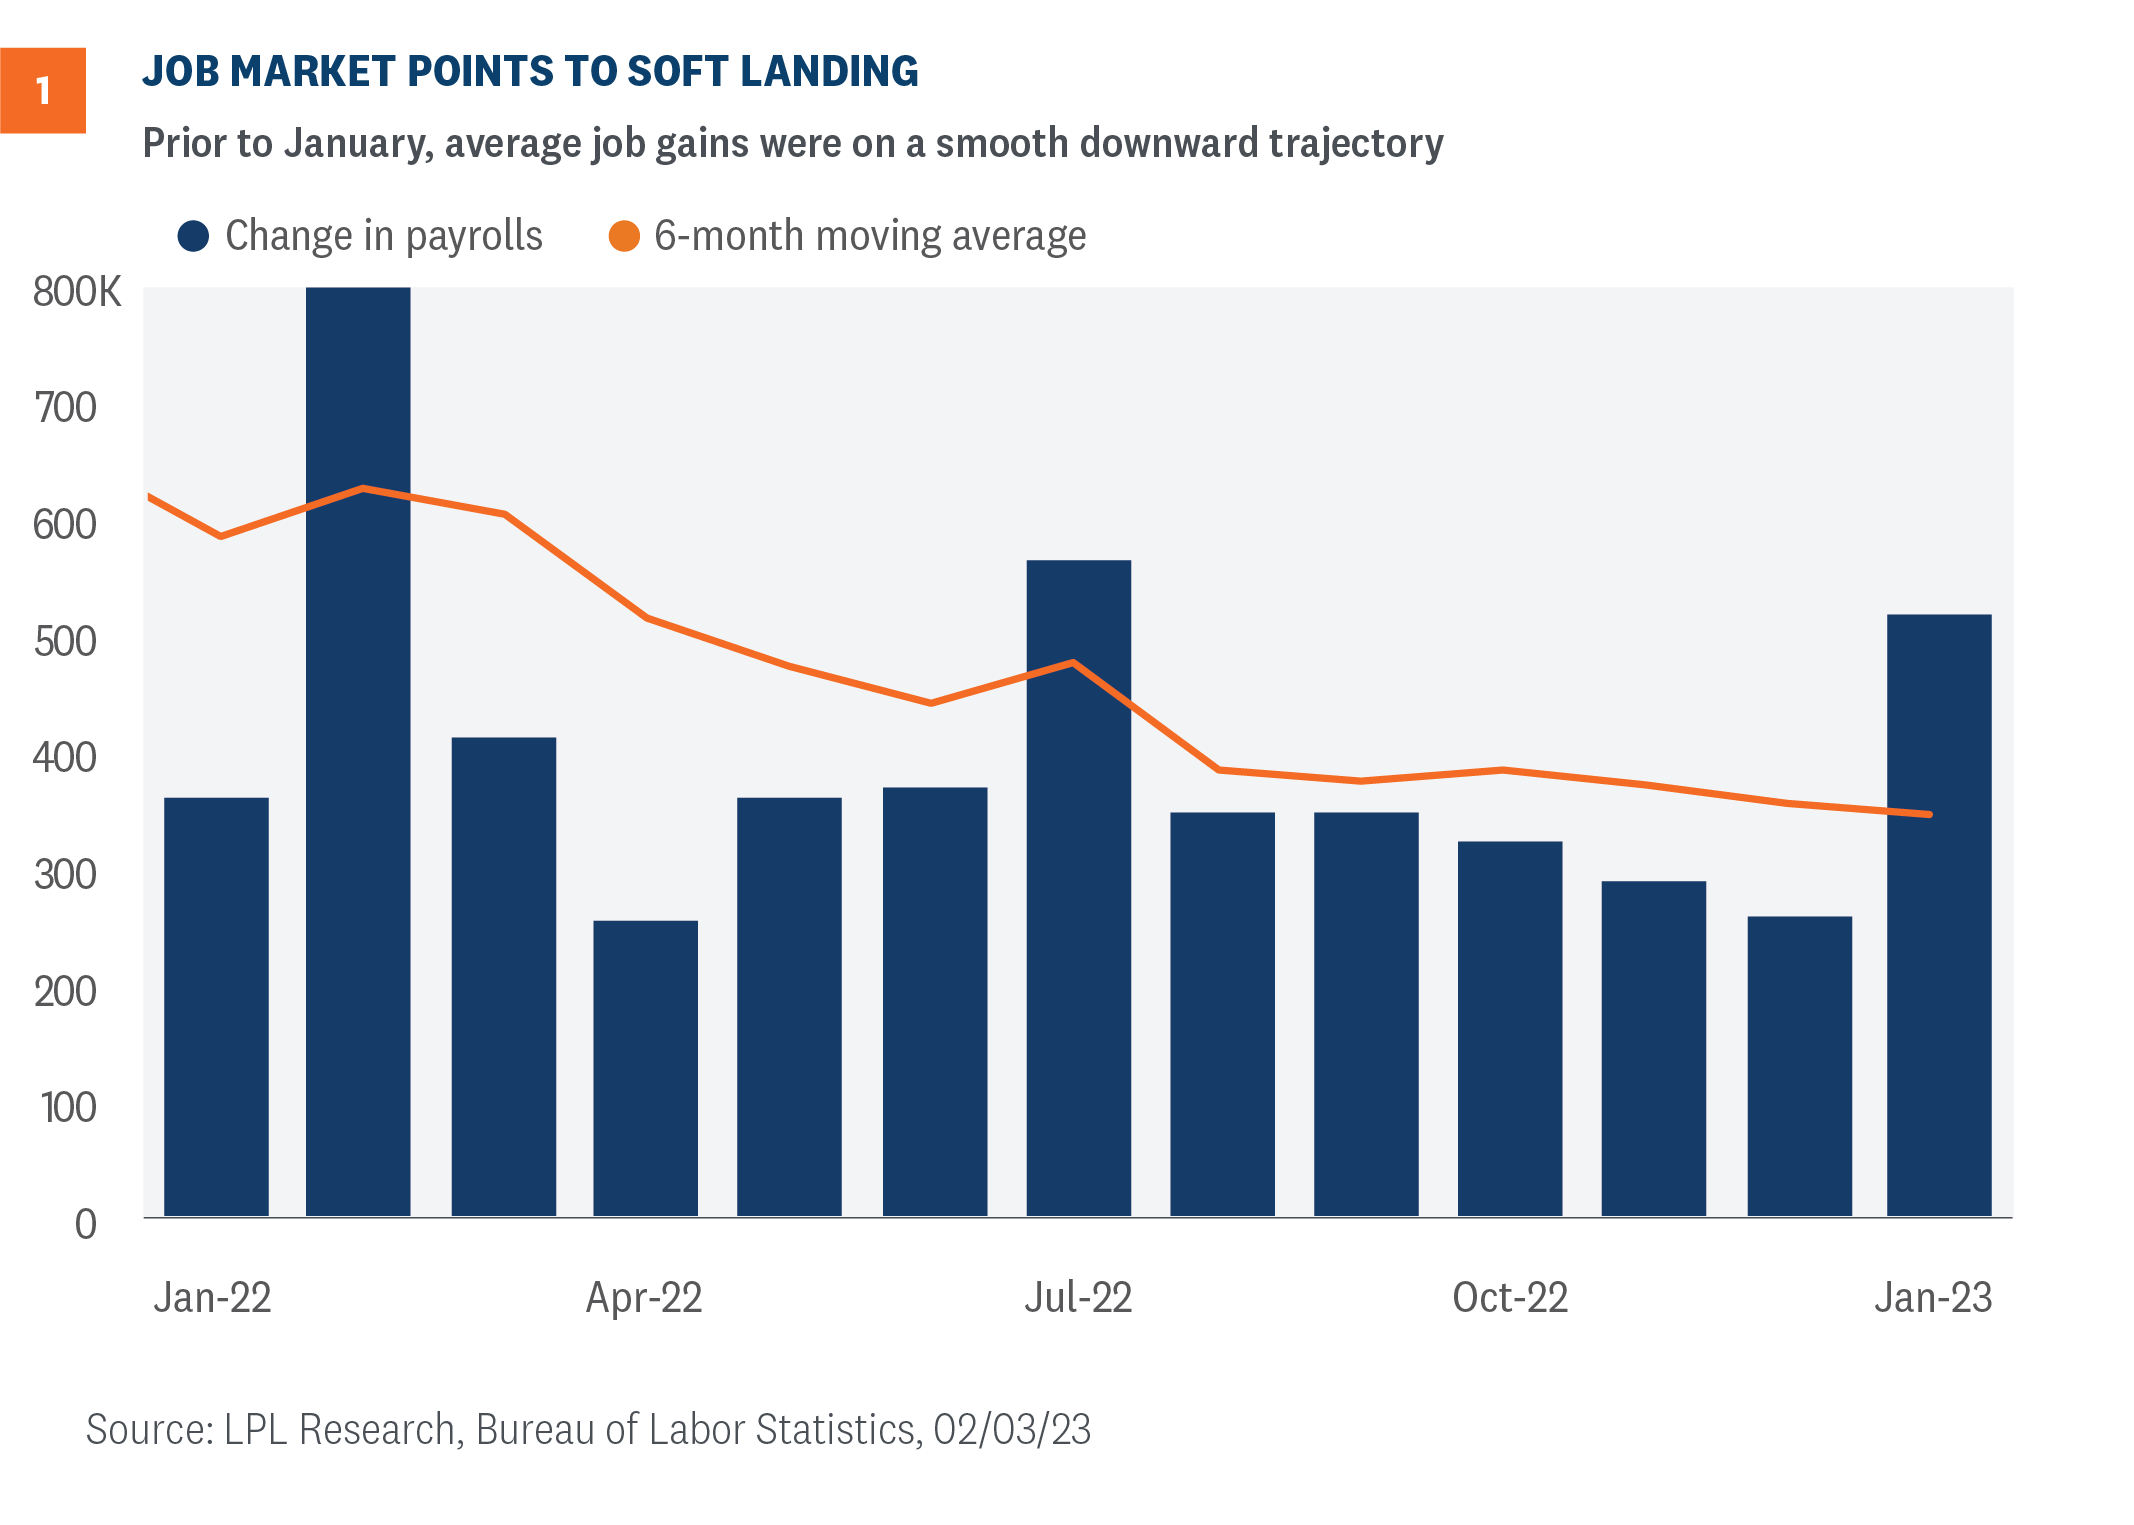
chart 1

The unemployment rate was 3.4% as the labor market is still very tight—too tight for central bankers. But more importantly, wage pressures are abating. Growth in average hourly earnings continues to slow, easing down to 4.4% year-over-year in January.

Low participation rates continue to weigh on the minds of economists and investors, but it’s important to remember that business formation stats are consistently growing above pre-pandemic levels, revealing many workers’ interests in alternative employment and one reason why some of the workers remain out of the official labor force.

So bottom line here is the labor market is still solid, offsetting some risk of slower consumer spending. Additionally, the slowdown in average hourly earnings should ease inflationary pressures in the near term as wage growth comes back in line. No doubt the Fed will continue to increase rates at the next meeting to slow the demand side of the economy.

Consumers’ Debt Load Remains Manageable

As Figure 2 illustrates, consumers hold much less debt now relative to previous cycles. After the Great Financial Crisis, consumers started aggressively deleveraging. Overall debt payments as a percent of disposable income declined and remained steady until the emergence of COVID-19 and most recently, the debt service burden on the American household moved back up to pre-pandemic levels but still relatively low. The job market is tight, which means personal income growth is supporting consumer spending along with the accumulated excess savings. To further pad personal spending, consumers will likely tap into consumer credit. We expect revolving credit demand to increase in the first part of this year, but we don’t expect debt service payments to approach rates last seen in 2007 and 2008. This manageable debt load is a key component of the case for a possible soft landing.
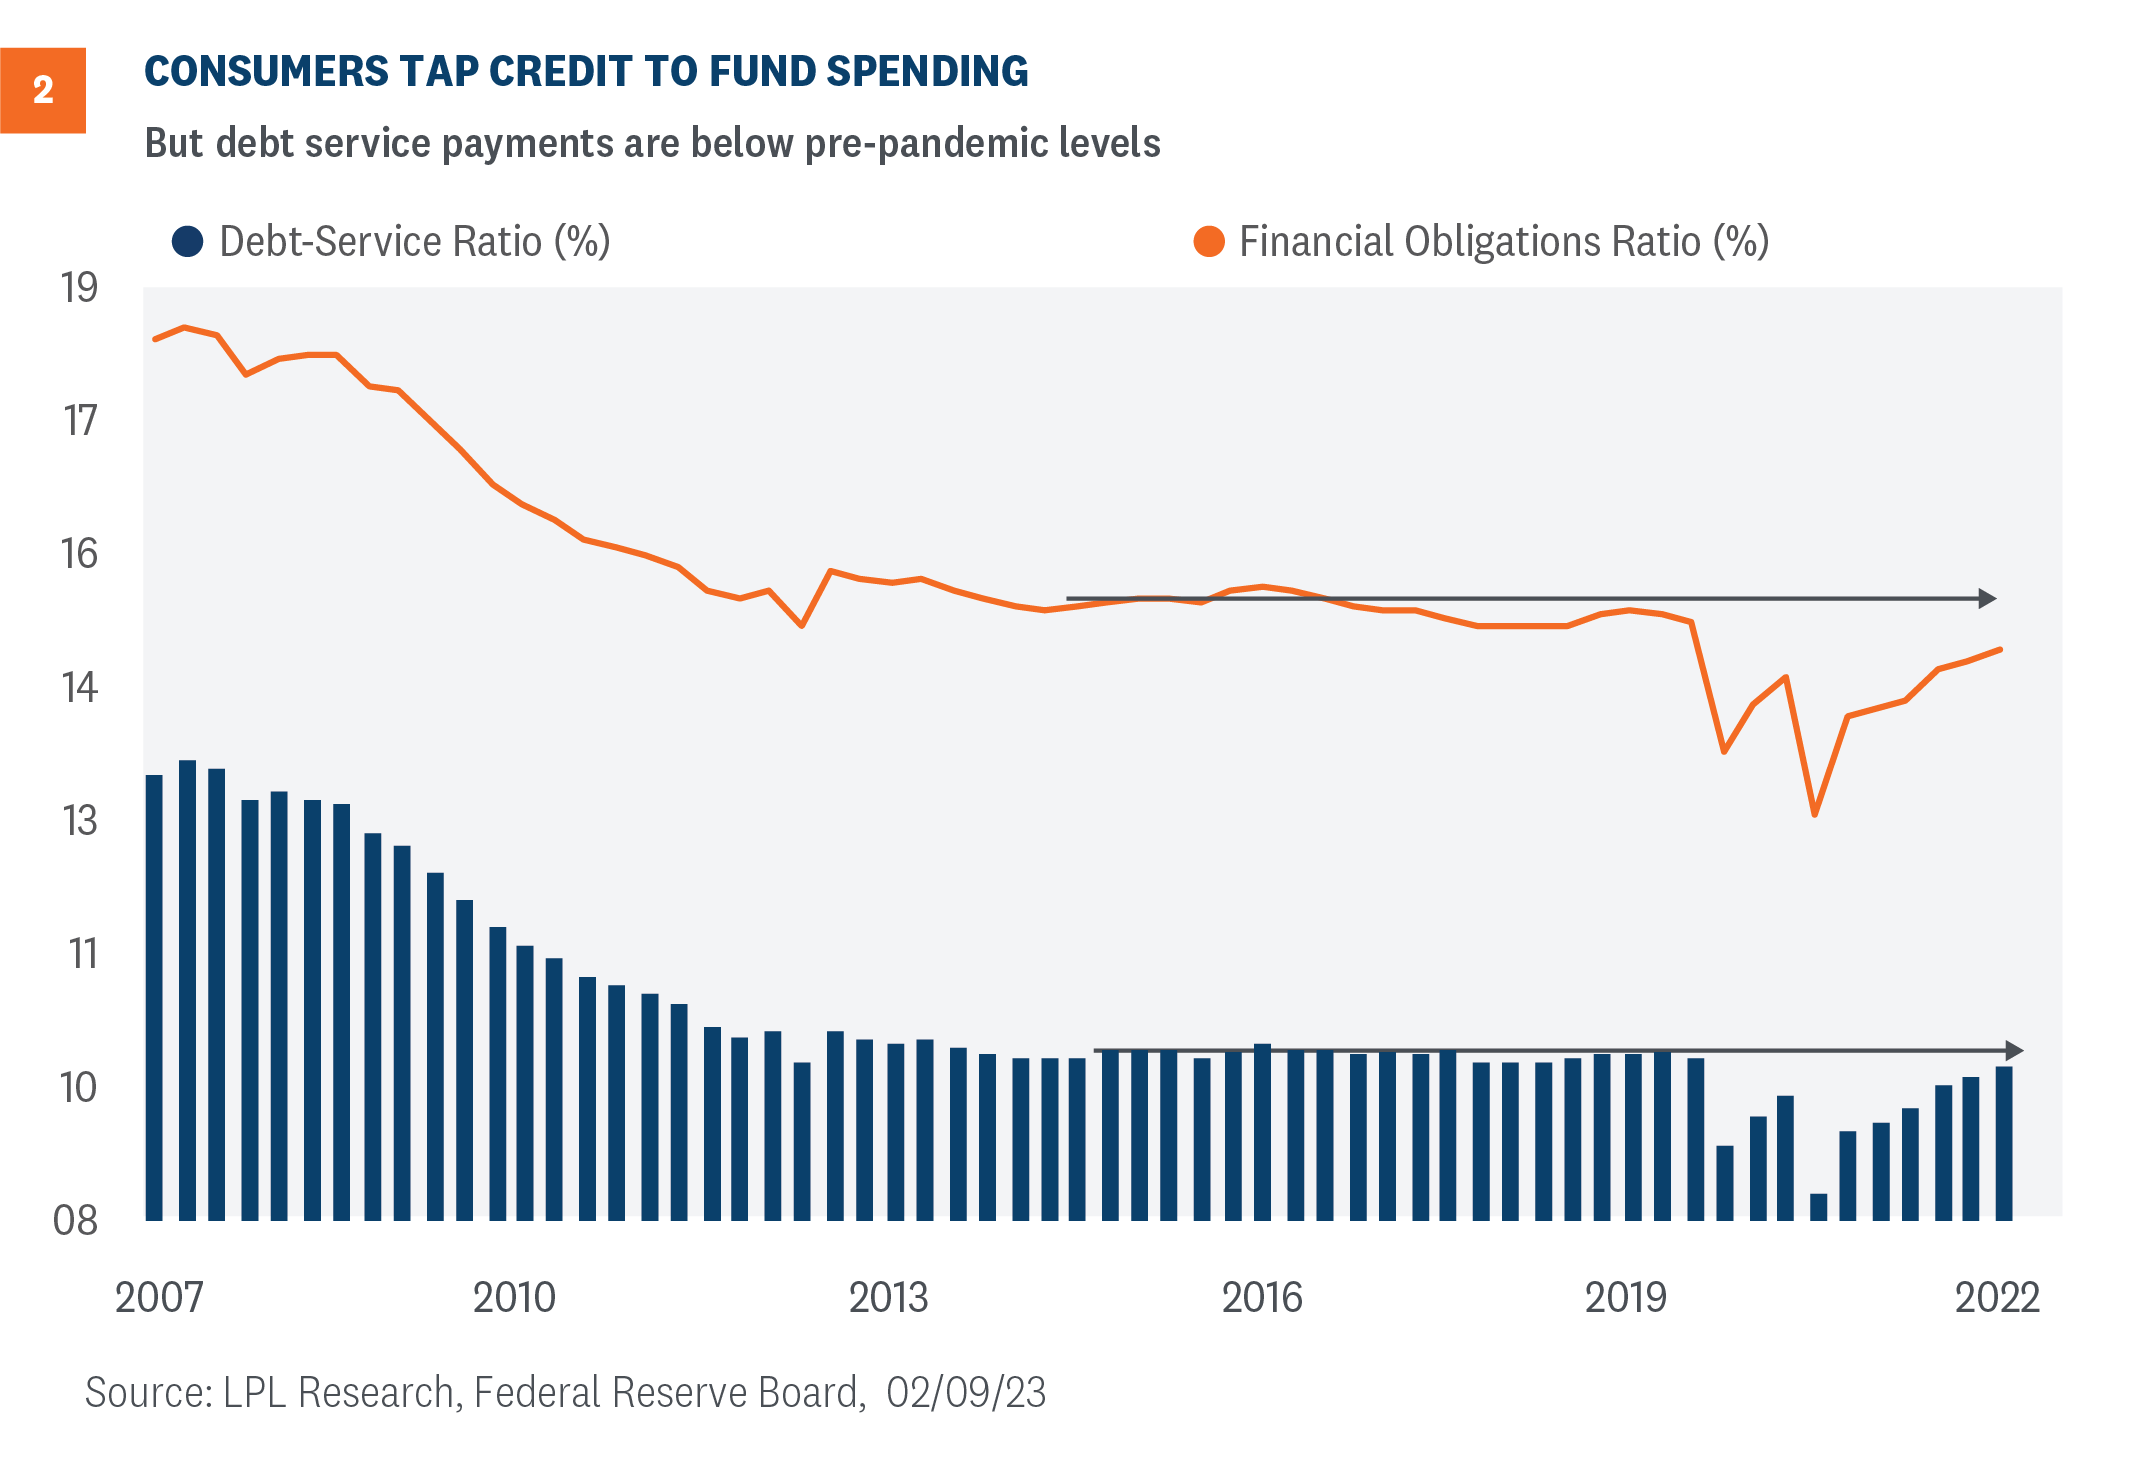
Chart 2

China Reopening May Help

As the world’s second largest economy, China’s economy reopening could help prospects for the U.S. in 2023. The International Monetary Fund (IMF), which recently upgraded its global growth forecast for 2023 to 2.9%, listed China and India as economic “bright spots” contributing to nearly half of global growth for 2023. China is expected to expand by 5.2% as the stringent Zero-COVID-19 measures that hampered its economy during the pandemic have been lifted.

Similarly, global ratings agency Fitch recently revised its 2023 forecast for China’s economic growth to 5.0% from 4.1%, noting that “consumption and activity” are recovering at a faster pace than initially expected. The Purchasing Managers Index (PMI), an important indicator for growth, has already begun to reflect a sharp rebound in activity, with a jump from 41.6 in December 2022 to 54.4 in January 2023.

According to official government announcements and reports, consumer spending and support for private businesses are a top priority to help stabilize the sputtering Chinese economy. China’s debt-laden real estate sector is also a major area of the economy that is scheduled to be helped by government support, including lower interest rates to help property developers.

Chinese officials have embarked on a campaign to revive its longstanding trading relationships, with high level visits and talks with Europe and Australia. Despite difficult bilateral relations with the U.S., there are indications both countries seek to continue trade ties, as China remains an integral part of the global supply chain. In addition, U.S. companies have continued operations in China and expect their earnings to increase as the economy gains momentum.

For the global economy, China’s recovery and resilience should help underpin the broader worldwide recovery. The healing of remaining supply chain challenges will be an important factor in the normalization in global economic growth, as will the normalization of overall trade relations. If the U.S. is going to achieve a soft landing, China’s impact on global growth will likely be a meaningful part of it.

Is a Soft Landing Priced In?

The outlook for economic growth and corporate profits is always a good place to start when forming a view of the equity market, but that’s only the first step. Next we ask perhaps the tougher question—what’s priced in?

The simple way to answer this question is with a basic price-to-earnings ratio (P/E). On a trailing four quarter basis, the S&P 500 Index is trading at a P/E of 19, in line with the 30-year average. That suggests valuations are fair and that a soft landing, or short-lived, mild recession, is probably priced in. Earnings are a bit depressed, supporting higher valuations, but the challenging near-term economic outlook with still-high inflation and more Fed rate hikes forthcoming, perhaps argue against that. Upside risk to interest rates may also argue against that, though LPL Research sees manageable upside to yields this year from current levels at a 3.7% 10-year Treasury.

Interest rates are a powerful force in equity valuations as a lower risk alternative. Factoring in rates and calculating an equity risk premium (ERP, earnings / price vs. 10-Treasury yields) gives us a below-average valuation (Figure 3). The ERP of 1.6% is currently above (more attractive) the long-term average ERP of 0.9%, though it is one of the more expensive readings of the past decade, given the big jump in yields since summer 2020. 
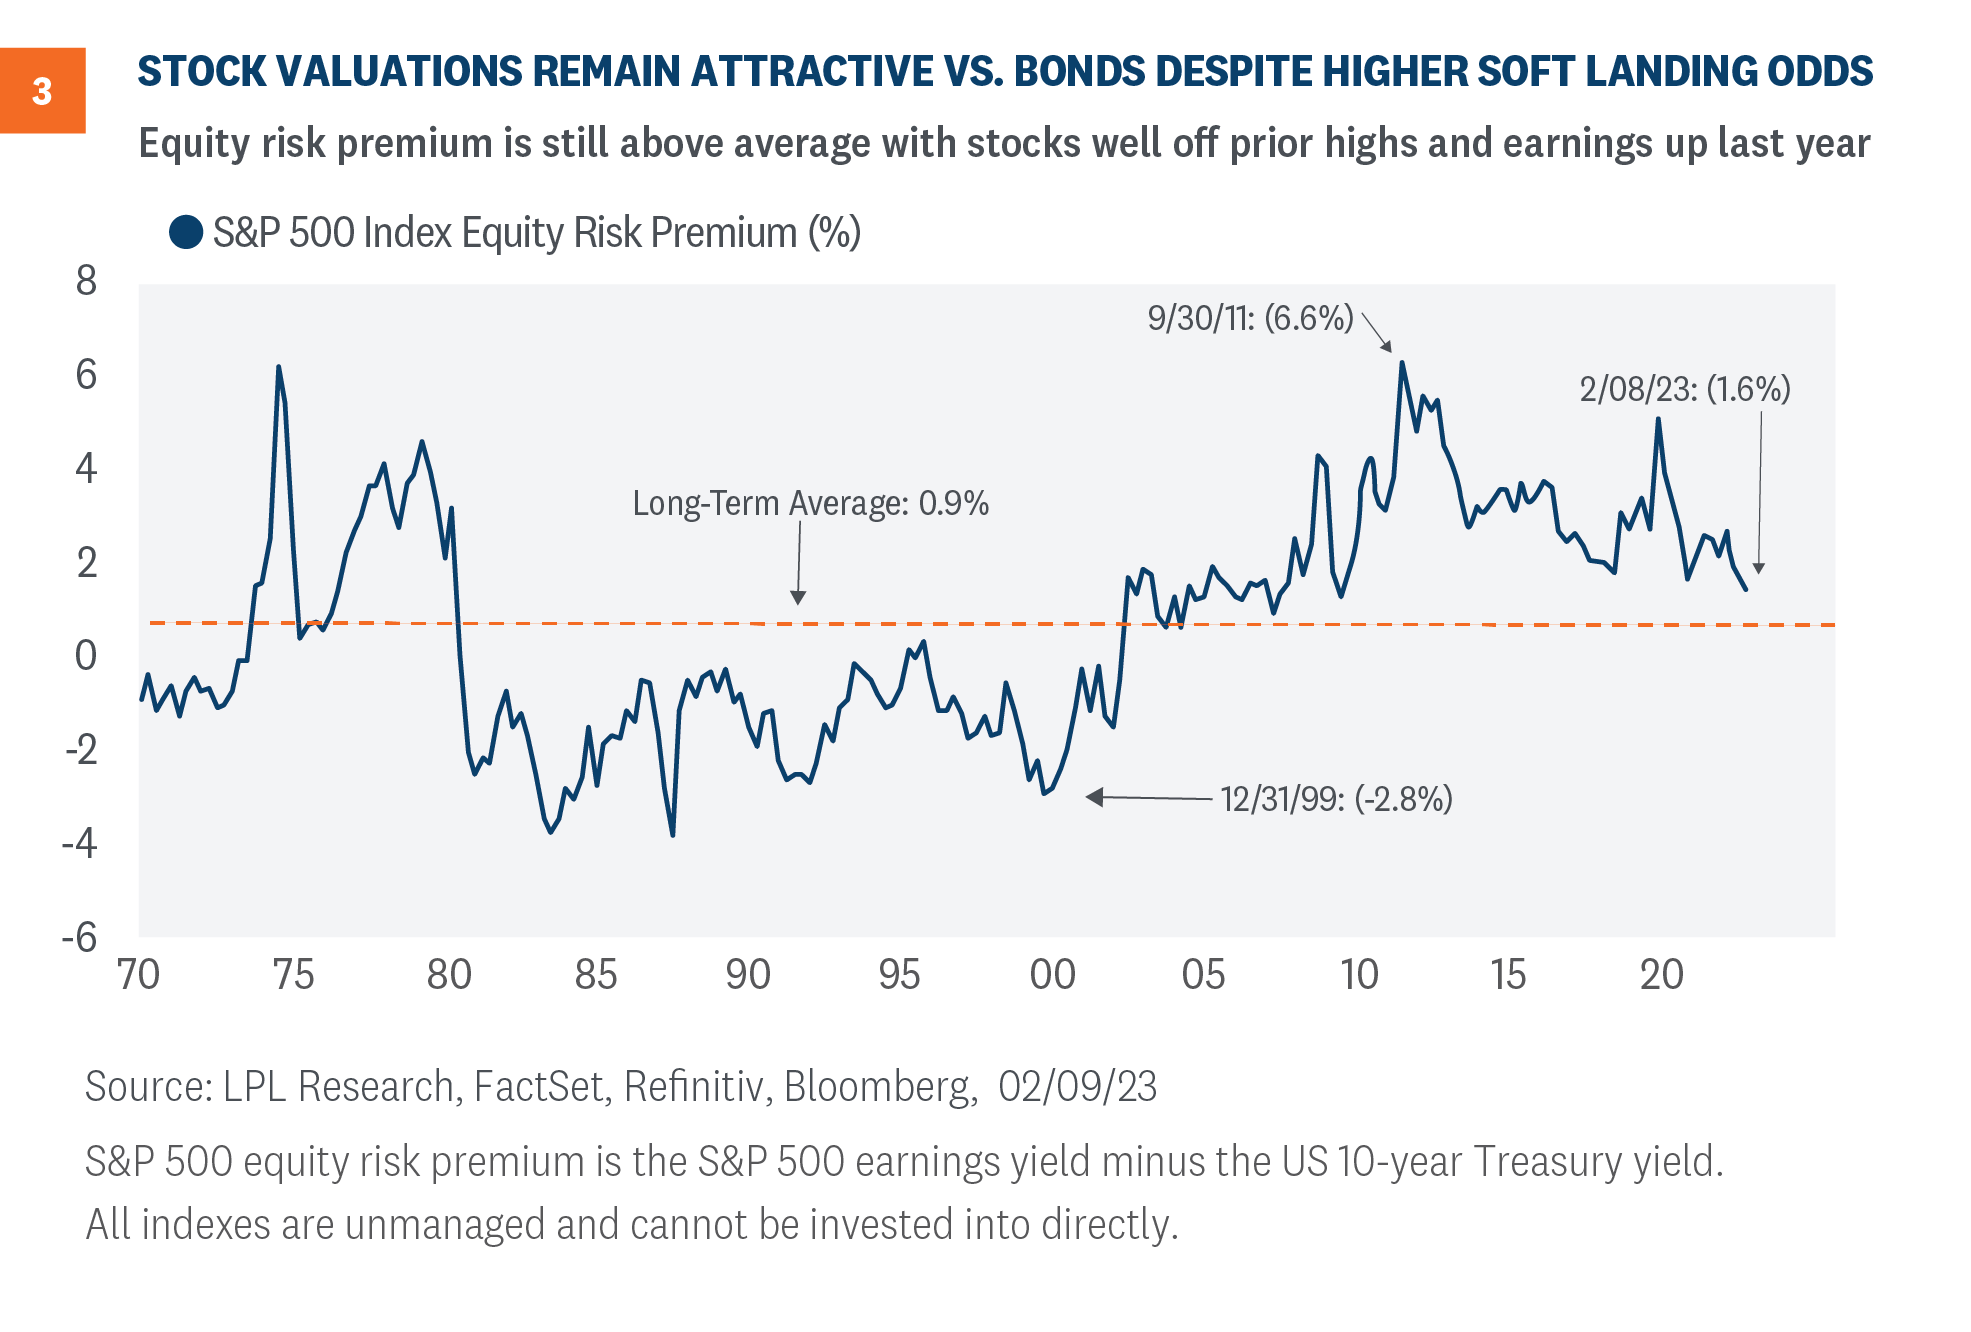
chart 3

So, do these higher valuations mean more downside risk for stocks? Not necessarily. The average bear market decline in a recession is about 29%. That includes all recessionary bear markets, including the really bad ones such as 2000–2002 and 2008–2009. Even if we get a recession this year, we simply do not expect it to be as deep as those two instances, suggesting the 25% peak-to-trough decline in the S&P 500 last year may have been sufficient to price in the risk of the current economic environment.

Another way to assess downside risk is to apply more of a typical recessionary haircut to valuations and earnings. Instead of 18–19 times $240 in 2024 (LPL Research base case assumptions), 16 times $230 in 2024 puts the S&P 500 at around 3,680 at year end (the index closed at 4,090 on Friday, February 10), seemingly a reasonable bear case scenario as laid out in our Outlook 2023: Finding Balance publication.

Evidence Investors Are Strongly Embracing Risk

Another way to assess what the market is pricing in is by looking at the strength in high-beta stocks year to date relative to their low beta (or low volatility) counterparts. Better returns for high-beta, or higher volatility, stocks indicate investor risk taking and, presumably, increasing odds of a soft landing. The strength of high beta stocks in January was the ninth best month out of the past 30 years (360 months), or higher than the third percentile. This suggests maybe the soft landing is priced in and any disappointment could result in some downside to stocks.

Bottom line, while we acknowledge downside risk to earnings in a recession scenario, the risk to valuations from further increases in interest rates, and the market’s increasing optimism based on where the biggest 2023 gains are so far, we expect the October lows to hold and see solid, double-digit gains for stocks in 2023.

Conclusion

The 14% move for the S&P 500 off the lows last October, despite the weakening earnings outlook, clearly tells us the market is pricing in a more optimistic outlook for the economy and corporate profits. But perhaps much of that move may be justified based on rising odds of a soft landing. Recent strength in the jobs market, while worrisome for the Fed, along with healthy consumer balance sheets and manageable debt loads, position the U.S. economy to potentially muddle through.

Valuations are fair by our assessment, not rich, and enable some upside potential as the market gains additional visibility into the potential resumption of earnings growth later this year and into 2024. LPL Research’s Strategic and Tactical Asset Allocation Committee (STAAC) maintains its overweight recommendation on equities and 2023 year-end fair value target of 4,400 to 4,500, based on 18.5 times 2024 earnings per share of $240.

Jeffrey Buchbinder, CFA, Chief Equity Strategist, LPL Financial

Quincy Krosby, PhD, Chief Global Strategist, LPL Financial

Jeffrey Roach, PhD, Chief Economist, LPL Financial

Investors got more excited about international investing late last year. Some of that was chasing better returns, as developed international equities solidly beat the U.S. over the last three months of 2022. Some was the increased popularity of value investing as mega-cap U.S. technology stocks became less in favor. The surprising resilience of core European economies and a weaker U.S. dollar added to the market’s excitement. After such strong performance in international benchmarks recently, is there enough good news still yet to come for these markets to continue to outpace the U.S.?

International Earnings Outlook Is Improving

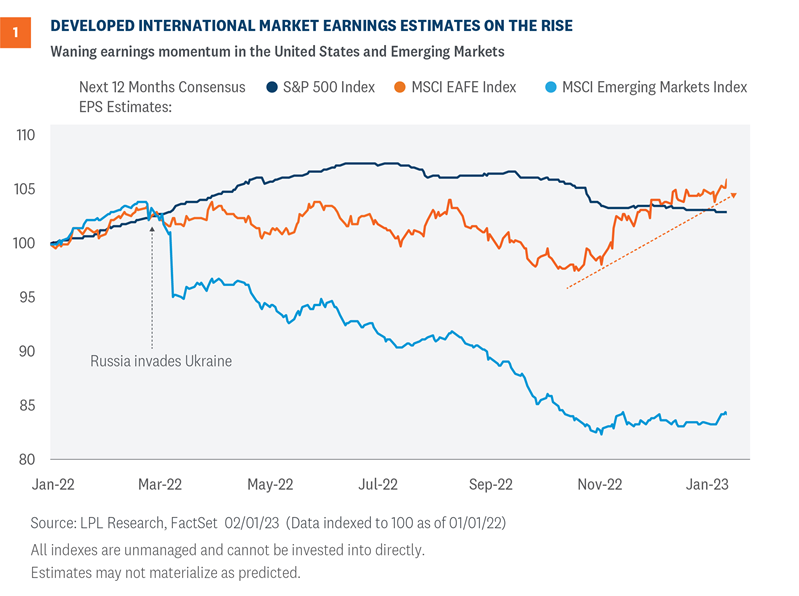
Earnings are, of course, the bottom line, so when looking at an equity investment we certainly can’t ignore earnings. The U.S. has been the clear earnings leader relative to international for the past decade, but the tide has recently turned. International earnings slightly outgrew U.S. earnings in 2022, (7.7% vs. 5.4% based on the latest estimates) and we believe international earnings may hold up slightly better in 2023 than the U.S.—it may be a 1-0 game, (a pitcher’s duel for you baseball fans) but the U.S. is no longer the place to go for earnings growth.

As shown in Figure 1, international earnings have also been exhibiting better momentum recently. Estimates have risen steadily over the past three months, while earnings estimates in the U.S. have edged lower and are likely to come down further. A weaker U.S. dollar translating into more non-U.S. earnings is a big part of the story, but there are other factors at work here. More on that below.

Emerging market (EM) earnings tumbled early in 2022 after Russia’s invasion of Ukraine and the subsequent removal of Russian companies from the index, and have stalled since. EM companies have had a difficult time translating economic growth into profits over the past decade for a number of reasons, largely China-related, a situation that does not appear likely to change in 2023.

chart 1

International Valuations Remain Attractive

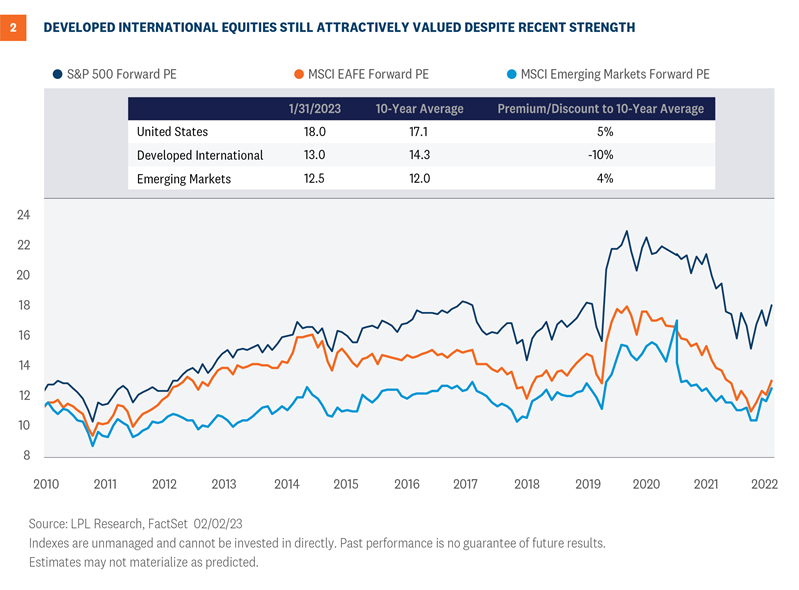
Turning to valuations, that slightly better (perhaps “less weak”) near-term earnings outlook does not come at a steeper price. International stock valuations have been lower than those in the U.S. for much of the past three decades. Despite recent outperformance, that gap between price-to-earnings ratios for the MSCI EAFE Index and the S&P 500 Index is still quite large (Figure 2). Developed international stocks are trading at a 28% discount to the S&P 500 on a forward price-to-earnings (PE) basis. That discount is the largest in at least 30 years, and larger than the average discount over the past 10 years of 16%. The valuation discount for international has grown so large that it is actually in line with EM.

Chart 2

Absolute valuations relative to history also make international valuations look attractive. The current forward P/E of 13 for the MSCI EAFE is 10% below its 10-year average, while the U.S. and EM are 0.9 points and 0.5 points above average by the same measure.

Even if we adjust international for its different sector mix, it’s only 8% more expensive (so still a 20% discount to the U.S. on an apples-to-apples basis). After many headfakes since the 2008-2009 global financial crisis, where short rallies in international evaporated and the long-term downtrend in relative performance resumed, this time could potentially be more sustainable.

Resilient European Economies

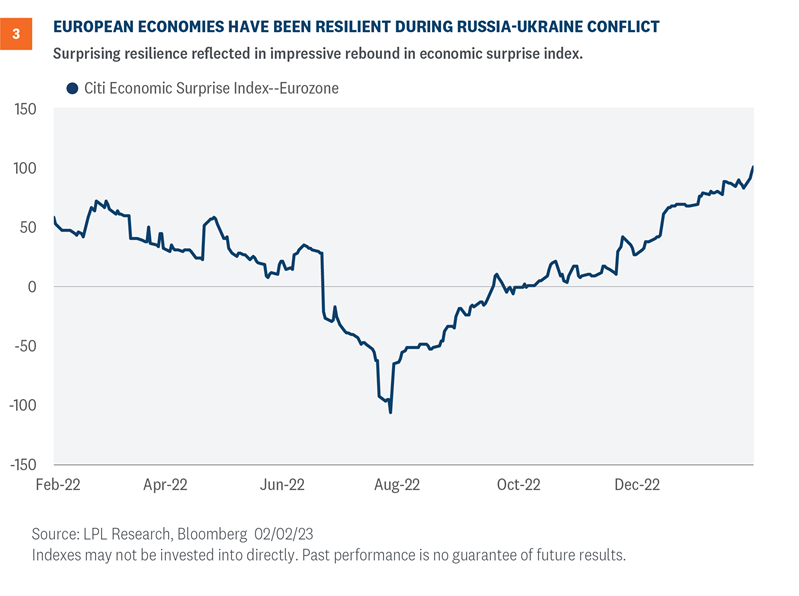
Europe’s surprising resilience has undoubtedly been part of the improving international story. European markets have demonstrated solid resilience despite mounting concerns over the ongoing Russia/Ukraine conflict, natural gas supplies, interest rates climbing higher as the European Central Bank (ECB) continues to raise rates, and a slow start to China’s reopening.

Recent official Eurostat data releases suggest the Eurozone expanded by 0.1% in the fourth quarter of 2022 compared with the third quarter. Moreover, the most recent Purchasing Managers’ Index, which includes both manufacturing and services, indicated a modest expansion for the first time in six months. In addition, the International Monetary Fund (IMF) upgraded its 2023 economic forecast for the Eurozone to 0.7%, from an initial projection of 0.5% made in October.

Natural gas prices, which had climbed higher at the onset of the military conflict, turned considerably lower as supplies were restored and moderate weather helped restrain demand. Also bolstering economic and market expectations is China’s reopening, which is expected to restore China’s historically strong trade relationships with Eurozone nations, particularly Germany, France, and Italy.

Although concerns remain that the very modest recovery could edge lower, the widely followed ZEW index that serves as a barometer for German investor sentiment moved into positive territory in February, reflecting a marked shift in expectations. The index had remained negative since before the onset of the Russia/Ukraine conflict. Christine Lagarde, president of the ECB, commented in late January that “the news has become much more positive in the last few weeks.” That can be seen in the Eurozone economic surprise index, shown in Figure 3.

chart 3

We don’t know how long this better news will last, and downsize risks clearly remain, but international investors seem to be using a glimmer of sun to make some hay.

U.S. Dollar Shifting from Headwind to Tailwind

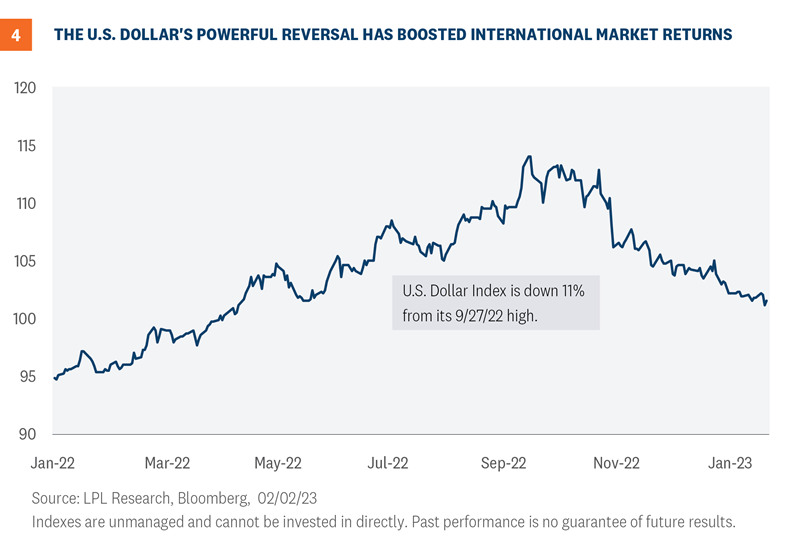
During 2022, as the Federal Reserve (Fed) launched its aggressive interest rate hiking campaign, the U.S. dollar began a near-parabolic climb above developed market currencies (Figure 4). S&P 500 multinational companies felt the sting of the escalating dollar, and in earnings reports the strong dollar was mentioned as a significant headwind as their foreign earnings were reduced as they were converted into dollars. Approximately 40% of S&P 500 earnings originate in non-U.S. markets.

chart 4

As it became apparent the Fed was planning to move towards smaller hikes, the dollar began to ease considerably in the fall of 2022. Also, whenever Fed Chair Jerome Powell mentioned there was a possibility for a soft economic landing, the dollar softened even more.

In early 2023, the dollar transitioned from being a headwind to a tailwind that could help underpin multinational earnings and U.S. investor returns in non-U.S. investments. Companies with a strong input from foreign earnings are seeing more interest from investors than companies that are more domestically focused. The currency translation to dollars is now helping earnings rather than hurting them.

Currency movements are notoriously hard to forecast, but we believe the odds favor a lower rather than higher dollar over the balance of this year.

Conclusion

As we weigh the pros and cons of international equities relative to the U.S., the ledger is looking more balanced. Earnings are soft everywhere, but maybe international delivers slightly better earnings growth in 2023. International equities are cheap, but they’ve been cheap for a while and adjusting for sector exposures (much less high valuation technology/digital media/eCommerce exposure than the U.S.), valuations aren’t as compelling.

The weight of the evidence based on technical analysis may point to international, but the last couple of weeks show us why we may not want to count the U.S. out. Especially with economic risks in Europe high in the intermediate term and no guarantee of further U.S. dollar weakness.

So while the international outlook is improved, we also believe investors should hold at least benchmark level exposure to U.S. equities, if not slightly more, at the expense of fixed income. The U.S. is where the innovation is, which won’t stop because of still-elevated inflation or fears of recession. And the end of the Fed rate hiking campaign is approaching as inflation comes down, despite Friday’s strong jobs number.

Jeffrey Buchbinder, CFA, Chief Equity Strategist, LPL Financial

Quincy Krosby, PhD, Chief Global Strategist, LPL Financial

The script has been flipped in 2023. Last year’s underperformers have turned into outperformers this year, driving the S&P 500 Index up over 5% this month. The pace and composition of the rally have left many investors skeptical over its sustainability, especially amid a lackluster earnings season thus far. Of course, the market is also forward-looking, with expectations for falling inflation and a less hawkish Federal Reserve (Fed) as we progress into 2023. And although the trajectory of the rally will likely slow, seasonal indicators point to a path higher for U.S. equity markets by year-end.

For background, market seasonality is premised on the adage of ‘history doesn’t repeat, but it often rhymes.’ The embedded assumption is the market exhibits seasonal patterns or cycles that ‘rhyme’ throughout history, or more specifically when prices move in a recognizable pattern that occurs with some degree of consistency over a specific timeframe. These patterns can last anywhere from several days to several years, each having its own tendencies unique to that period. For example, we are now in year three of the presidential cycle, historically the best-performing year for stocks across the four-year cycle. By no means is seasonality flawless, as pricing patterns are historical tendencies and not a guarantee of future results. Within LPL Research, we view seasonal data as one input, among many, into our decision-making process.

When various seasonal indicators tell the same story, the message becomes more powerful. The market is now on the cusp of receiving one of these ‘messages’ by potentially hitting a trifecta of seasonal indicators this month.

What are the components of the trifecta?

  1. Santa Claus Rally: This seasonal pattern was first discovered by Yale Hirsch in 1972. Hirsch, the creator of the popular Stock Trader’s Almanac, defined the period as the last five trading days of the year plus the first two trading days of the new year. A positive Santa Claus rally signal occurs when the S&P 500 posts a positive return during this timeframe. For 2023, the S&P 500 was up 0.8% during this period, checking the box for a positive signal.
  2. First Five Days: Hirsch also created the First Five Days indicator. This indicator is considered a warning system for the year ahead when the first five days of the year are negative. The S&P 500 finished the first five days of 2023 up 1.4%, checking the box for a positive First Five Days signal.  
  3. January Barometer: Last but not least, Hirsch also created the January Barometer indicator and its popular tagline of ‘As goes January, so goes this year’ (positive January returns are historically associated with positive annual returns). A positive January Barometer indicator occurs when the S&P 500 posts a positive return in January. With the S&P 500 up over 5% this month as of Friday, January 27, a positive signal is expected.

When all three of these indicators are positive, such as this year, the January Trifecta has been hit (credit for the Trifecta indicator goes to Jeff Hirsch, Yale’s son who has continued his Stock Trader’s Almanac work).

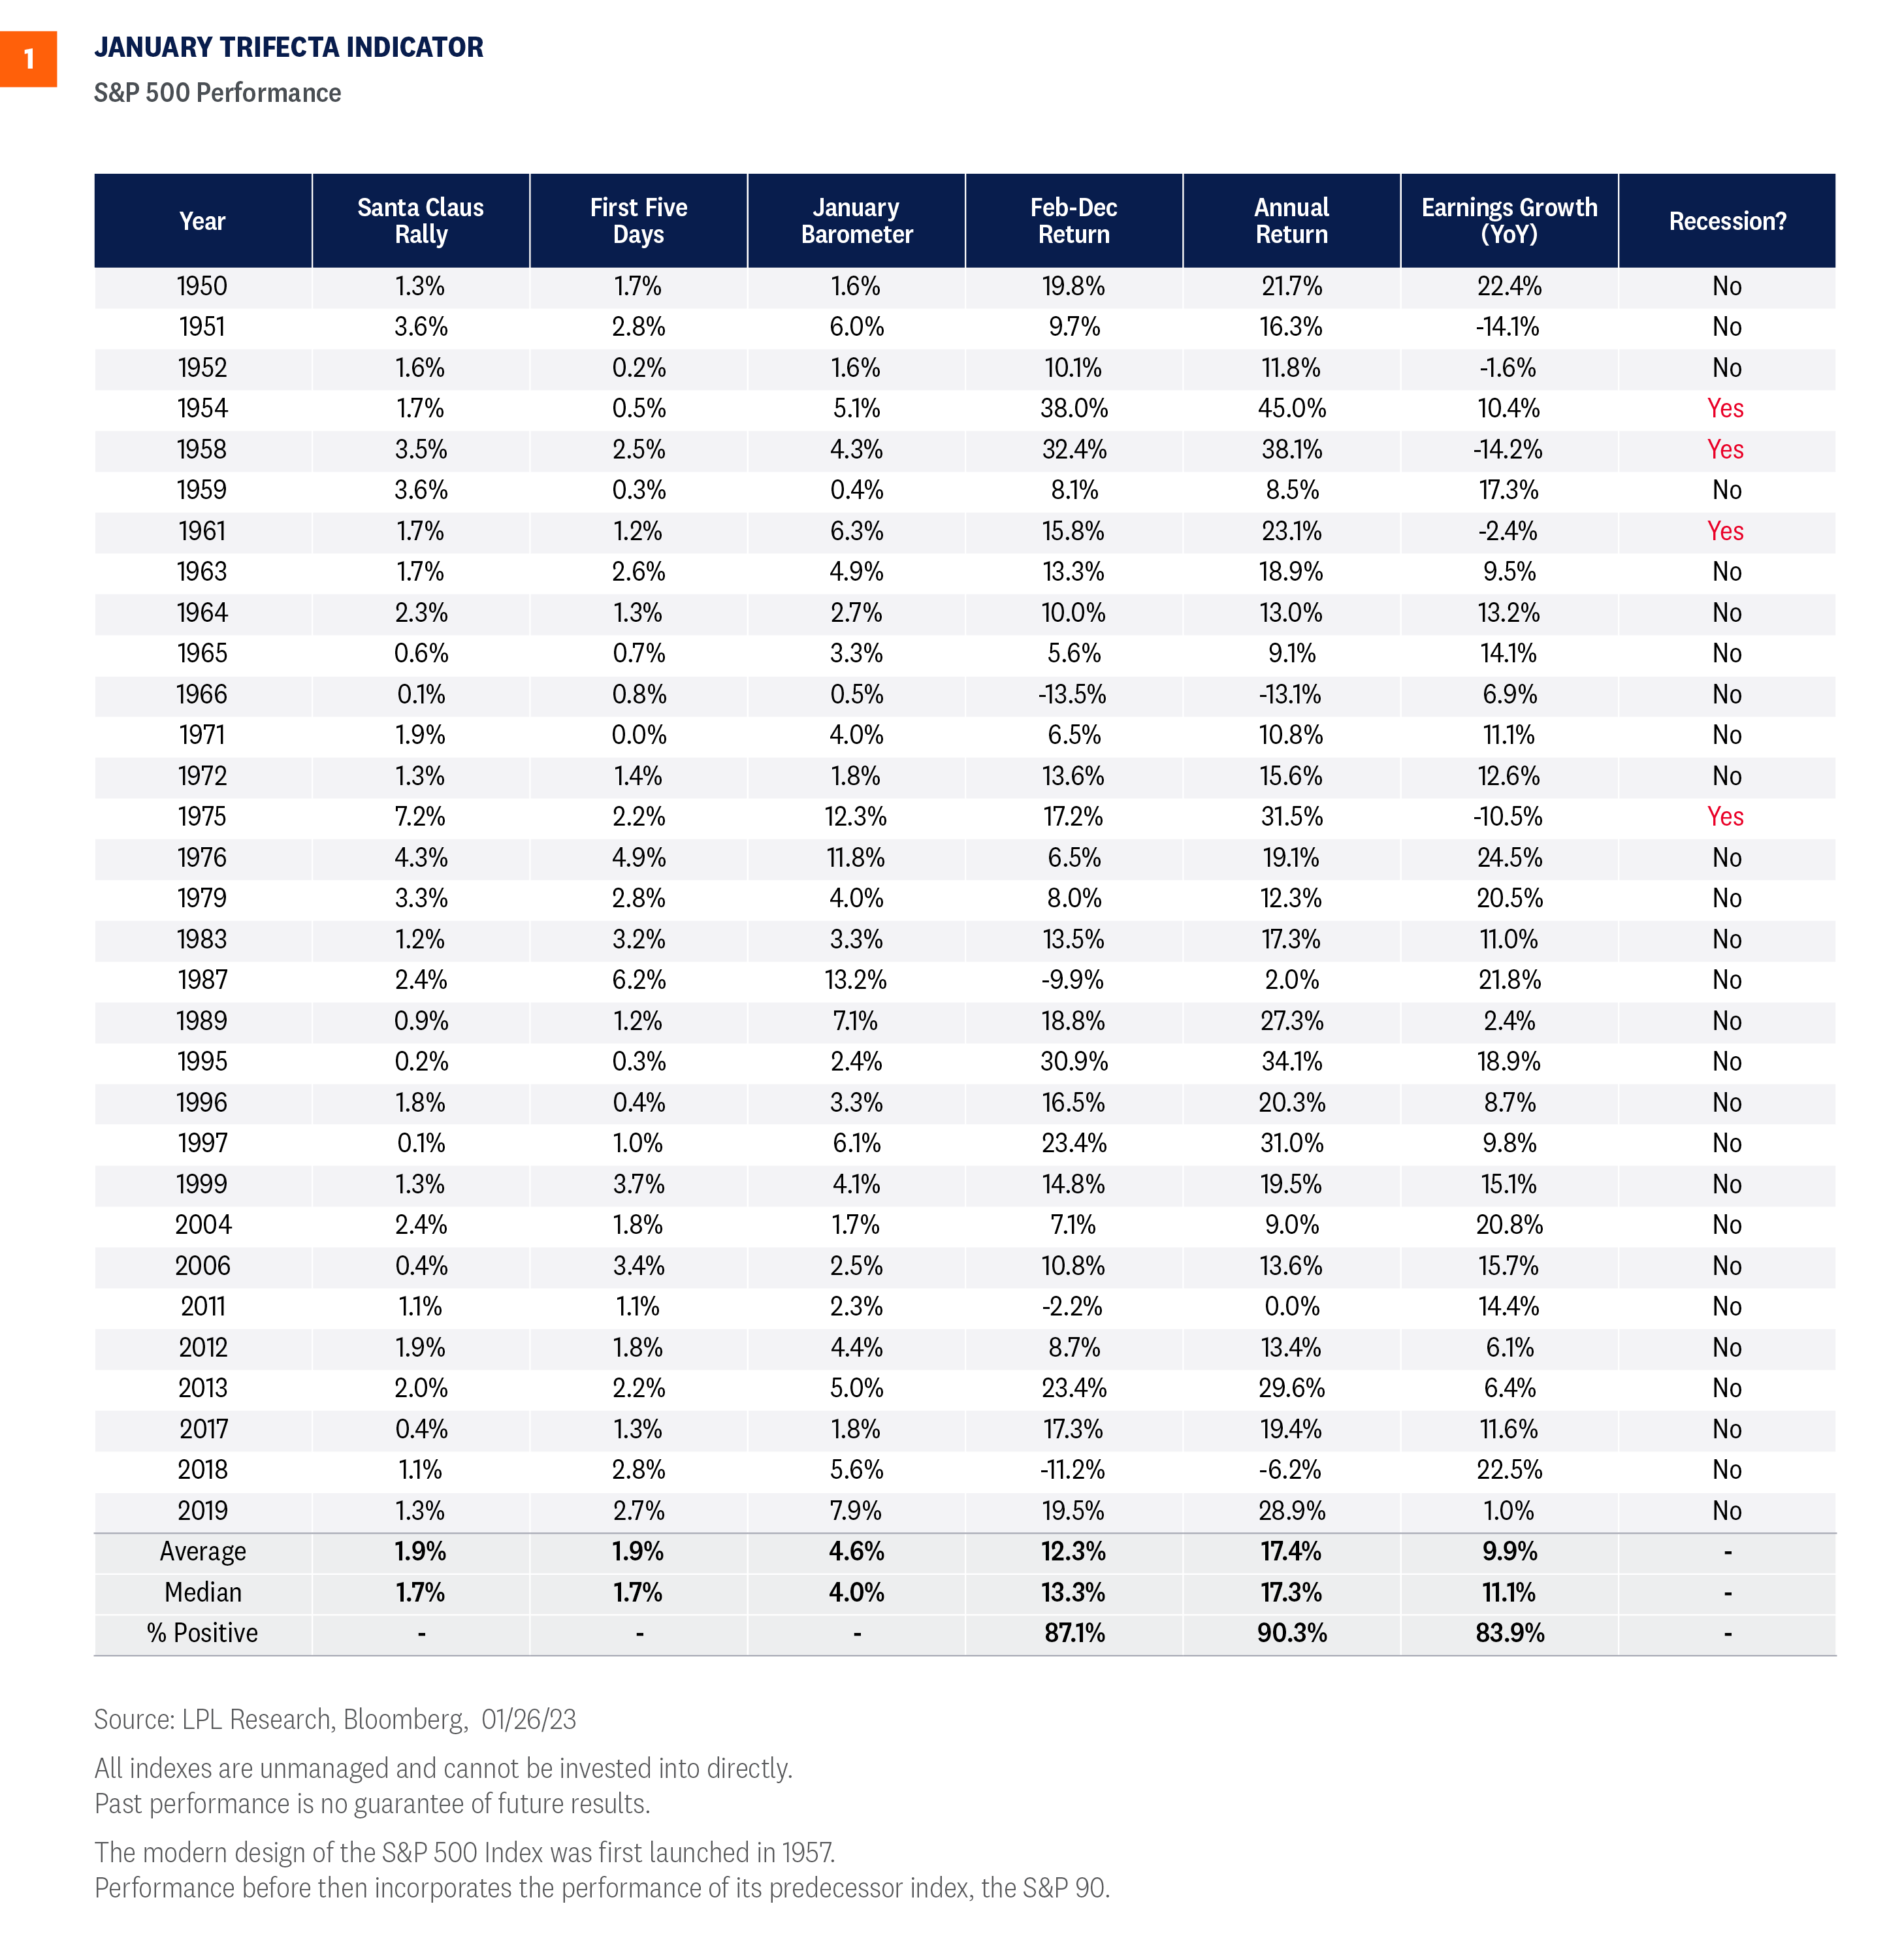
Figure 1 highlights various return metrics for years when the trifecta indicator was hit for the S&P 500. For additional context, we also included year-over-year earnings growth for the index, along with whether or not the year included a recession.

chart 1

Key Takeaways:

As you can see in the chart, the trifecta accomplished this month has historically led to some very strong returns. The S&P 500 has on average added 12.3% to a 4.6% January gain between February and December, bringing the average gain for these years to over 17%. This sounds like a big gain, and it is, but keep in mind the average gain in the third year of the four-year presidential cycle is 16.8%, and the average year following a down year is up 15%.

It also worth noting that with the broad market slipping nearly 20% last year, this gain still would not get the market back to the 2022 high set on January 3, 2022. Stocks enter 2023 much more attractively valued than a year ago—roughly 18 times forward (2023) earnings as compared to over 21 times forward (2022) earnings a year ago, based on FactSet estimates.

Steady Path to Gains

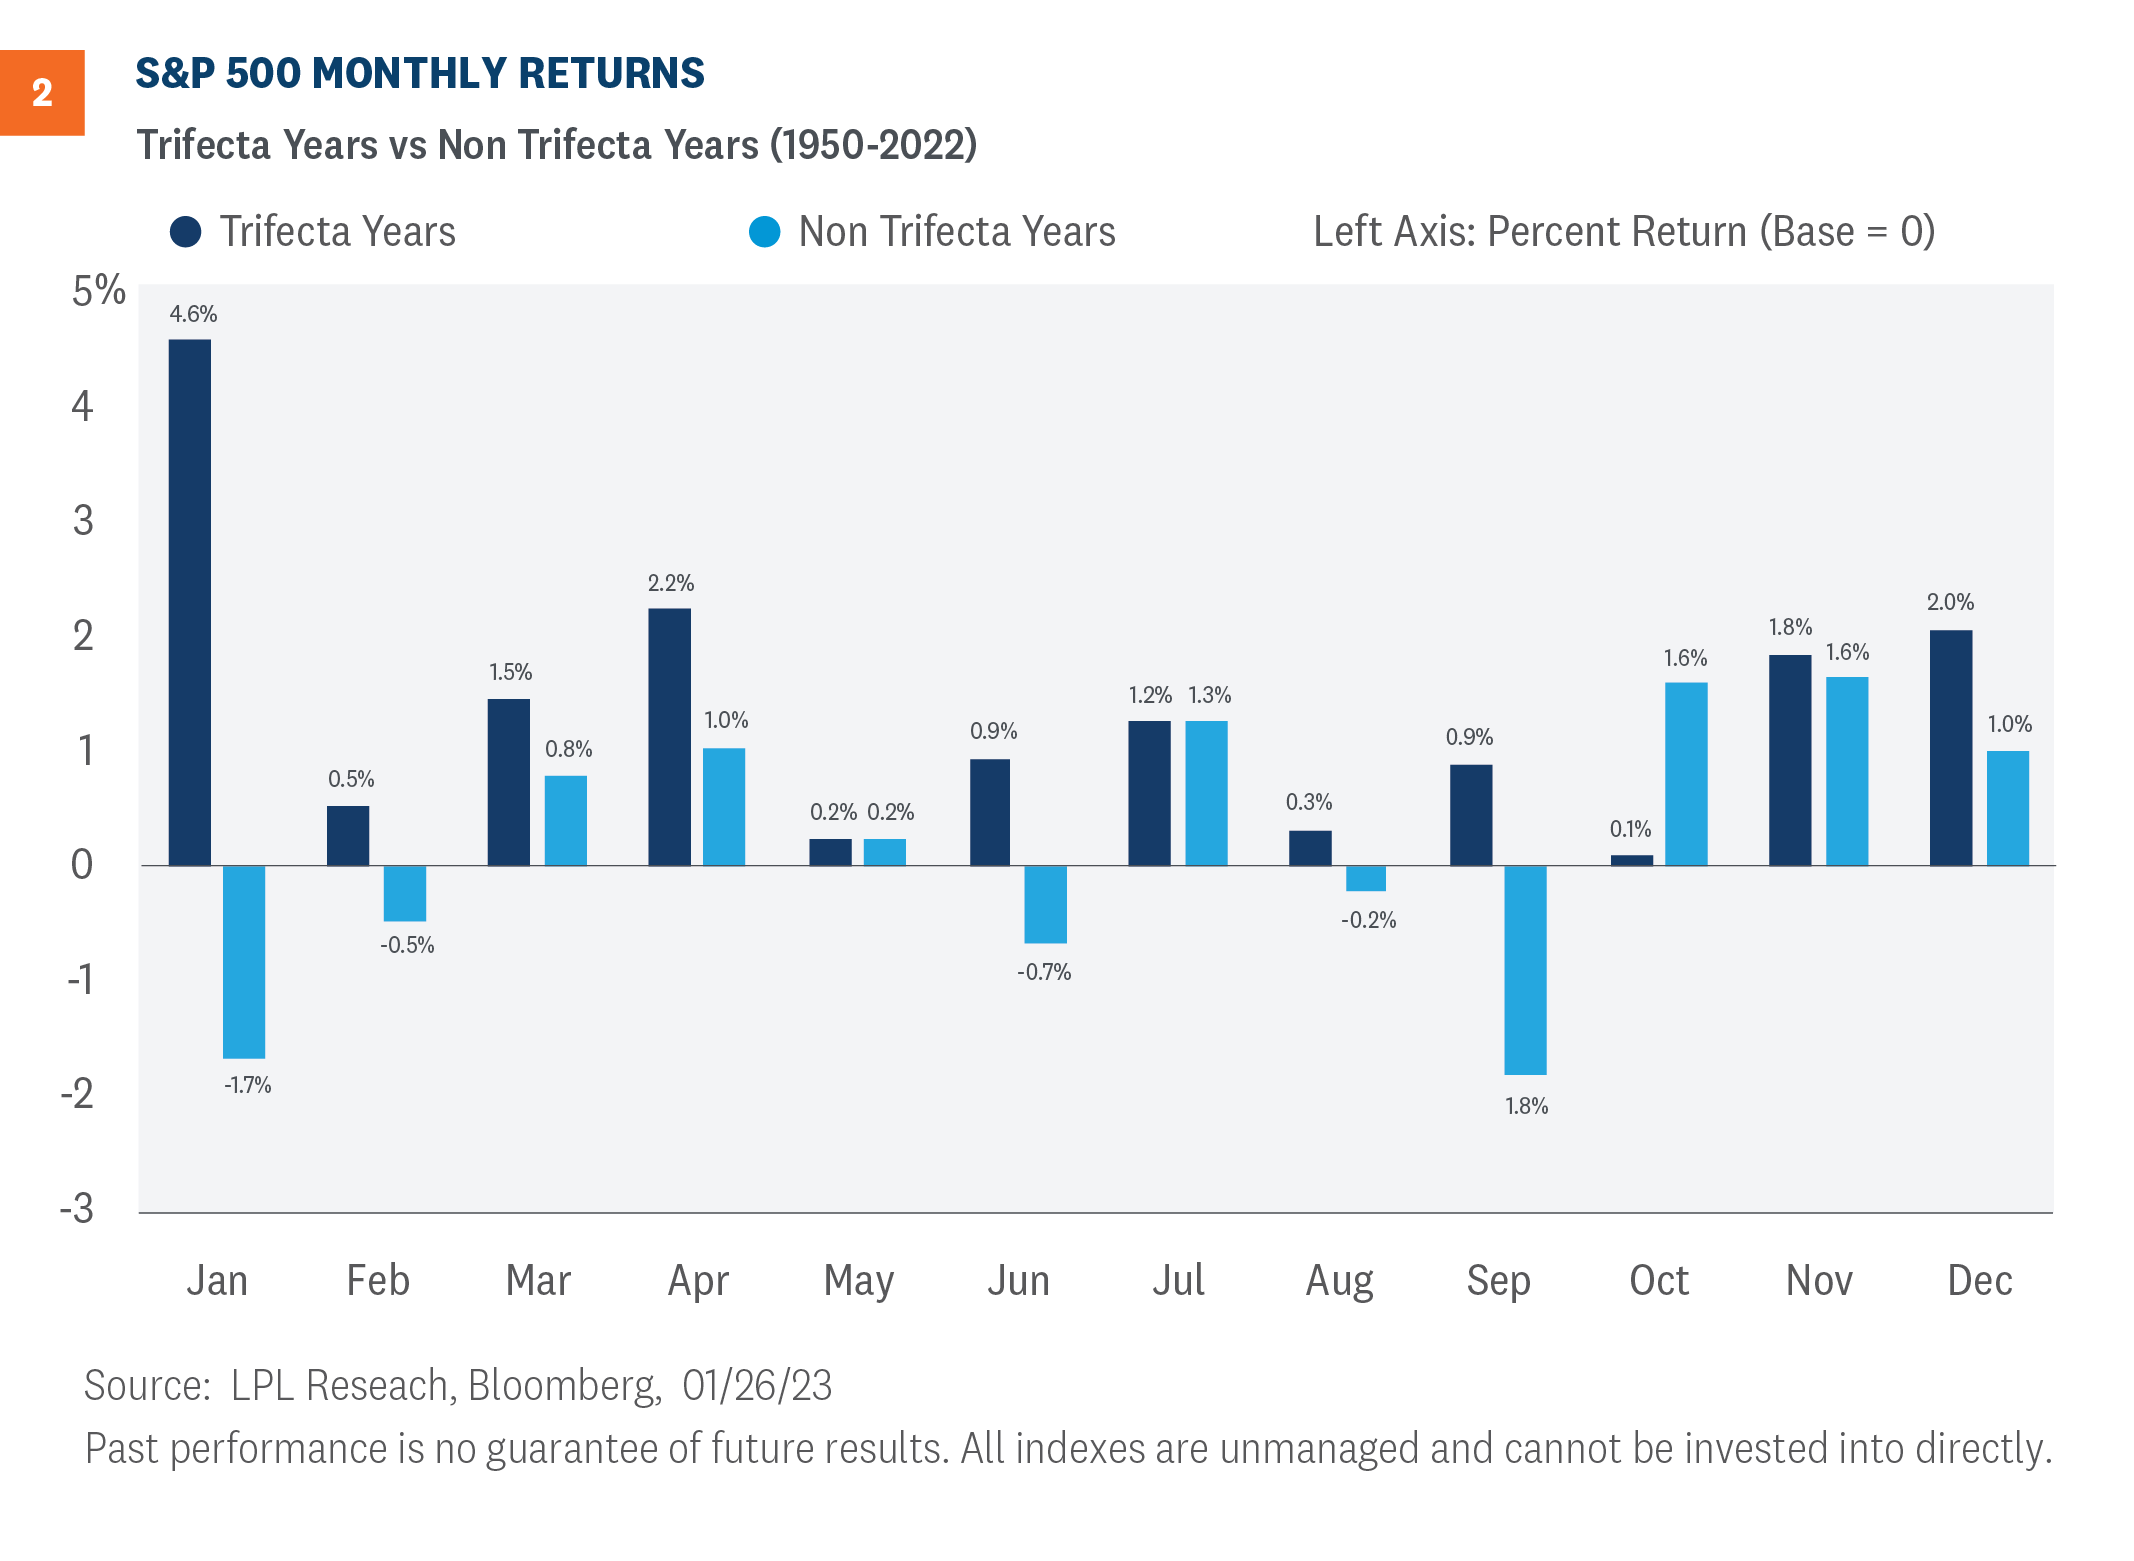
Finally, we also compared the monthly seasonality for trifecta years and non-trifecta years. Figure 2 highlights the returns across each scenario. While the strong January average returns during trifecta years decelerate in February, they do not historically turn negative. In fact, of the 31 trifecta years observed, all 12 months produced positive average monthly returns.

Chart 2

Conclusion

Stocks continue to climb the wall of worry despite mixed messages between technicals and fundamentals. Seasonality indicators, including the trifecta indicator, suggest the path of least resistance for the broader market is likely higher for the year ahead. And while the seasonality message is clear, the market still needs catalysts to climb higher. LPL Research believes the end of the Fed’s monetary policy tightening will be a key driver for stocks this year. Cooling inflation data will not only underpin a policy change, but also reduce headwinds for companies battling ongoing pricing pressures. The end of a rate hike cycle could also mean interest rate stabilization or even lower interest rates, another potential driver of equity market gains. Finally, while we believe recession risk remains high, there is the chance the U.S. economy is only facing a growth scare and muddles through on the back of a resilient consumer who is flush with cash. 

Adam Turnquist, CMT, Chief Technical Strategist, LPL Financial

Jeffrey Buchbinder, CFA, Chief Equity Strategist, LPL Financial

The latest episode of the debate between stock market bulls and bears has gotten more interesting. For every valid point from one side, there’s an equally compelling argument on the other side. Perhaps the best reason for the debate is the uniqueness of this environment. The pandemic and its aftermath don’t come with a historical playbook. We haven’t been here before. So we’ll just recognize that the outlook is uncertain, weigh the pros and cons, glean what we can from the past, and give it our best shot. Call us cautious bulls.

Topic 1: Economy

Bull case: Consumer is resilient, the labor market is strong, wages are rising, and inflation is coming down steadily.

Bear case: Inflation is still high, leading indicators are signaling recession, manufacturing activity and housing market have slowed significantly.

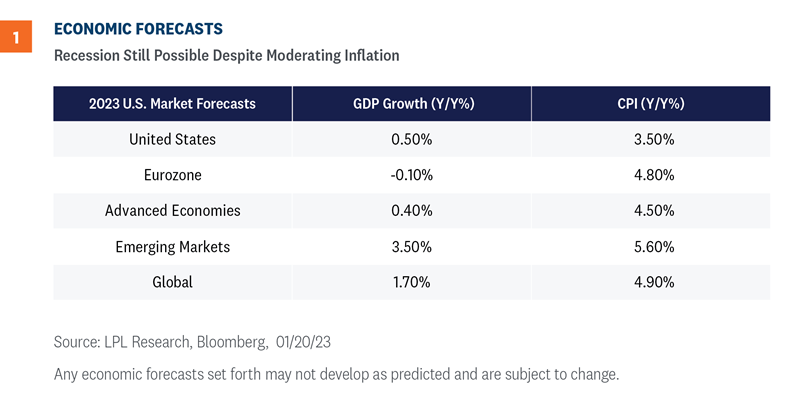
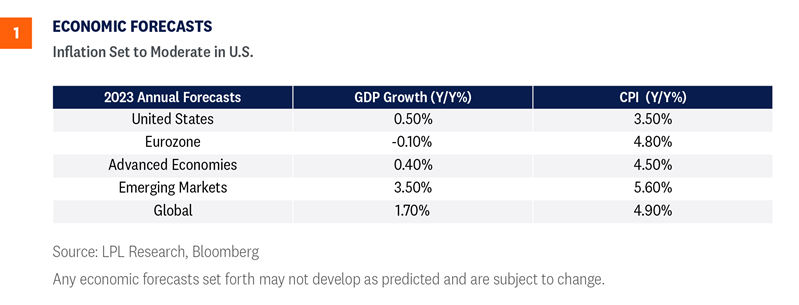
Background: The global economy will likely slow from the upper-2% range in 2022 down to slightly above zero in 2023 (Figure 1). Much depends on China’s growth path now that it has largely abandoned its overzealous Zero-COVID-19 policy. 

chart 1

If the U.S. falls into recession, the chances are it would occur during the first half of 2023 and will not likely be as deep as the 2008 recession, which was initiated by a fundamentally flawed financial market.

One reason we’re currently seeing a healthy debate on the likelihood of a recession is that most metrics that typically precede recessions are flashing warning signs. Business activity and consumer spending are contracting. However, recent data, including a stable labor market and decelerating inflation, suggest a soft landing may still be possible. As supply chains improve in the months ahead and Federal Reserve (Fed) tools become more impactful, we could see the rate of inflation decelerate more in 2023. So far, producer prices, wages, and survey data clearly point to improvement with inflation.

If the economy does fall into a recession, the cause will likely be from the consumer sector retrenching after years of inflationary pressures, high housing costs, and slow real wage growth.

Our take: The U.S. economy either narrowly avoids recession or enters a mild and short-lived recession in the early-to-middle portion of 2023. Easing inflation pressures and a stable job market with only modest additional tightening from the Fed are keys to limiting the severity of an economic downturn.

Topic 2: The Fed

Bull case: Pricing pressures continue to recede and the Fed ends its rate hike campaign this spring, essentially declaring victory on inflation and opening the door for potential rate cuts in the back half of the year. Interest rates continue to fall and/or stabilize, re-steepening the yield curve. Dollar weakness continues.

Bear case: Inflation proves sticky, prompting either further Fed tightening or a higher-for-longer policy path and raising the odds of recession. Interest rates move higher along with the dollar, weighing on risk assets.

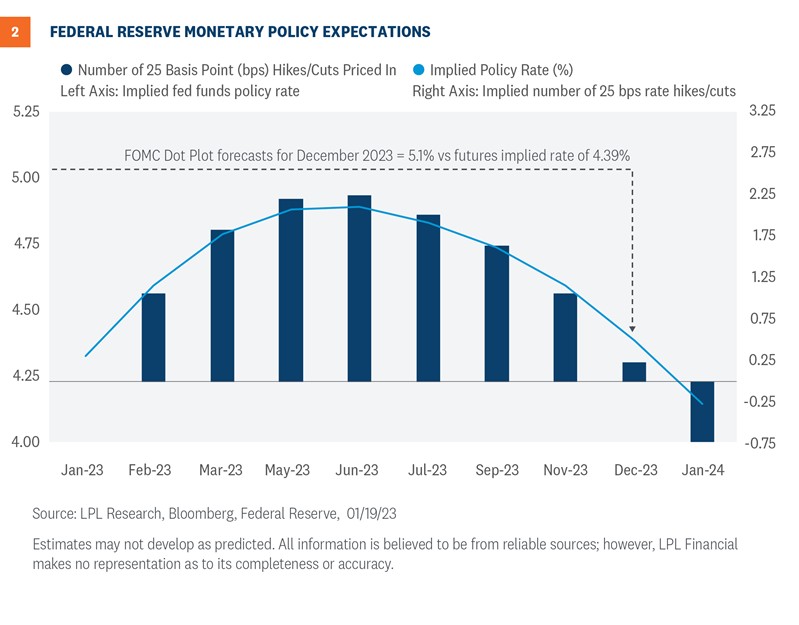
Background: The market maxim of ‘Don’t fight the Fed’ has proven prescient once again. Since the Fed embarked on its historic rate hike cycle last March, the S&P 500 Index entered a bear market and witnessed a 25% peak-to-trough drawdown in 2022. However, according to the futures market, the probability of the Fed reaching its last interest rate hike is inching closer. Forecasts suggest the Fed’s aggressive campaign to tackle inflation could be completed this spring. Moreover, and in stark contrast with Fed rhetoric, the futures market is indicating the Fed could cut interest rates toward the latter half of the year.

These projections are predicated on the assumption that inflation will continue to edge lower at a faster pace than initially expected. Recent inflation-related data, especially the Consumer Price Index (CPI) and the Personal Consumption Expenditures Index (PCE), both underscore that inflation has plateaued and is easing in key areas of the economy.

Figure 2 provides a visual of the contrasting interest rate projections between the Fed and futures market. The blue line depicts the implied policy rate based on probabilities from the fed funds futures market. As you may notice, a potential peak in the terminal rate is expected sometime this spring, which aligns with LPL Research’s 2023 outlook. Furthermore, the market has priced in rate cuts later this year, with the federal funds rate forecasted to reach the 4.25%–4.50% range by year-end. The dotted grey line highlights the latest Summary of Economic Projections (SEP) from the Fed, which shows policymakers’ forecast for a fed funds rate of 5.1% for the end of 2023 with no rate cuts penciled in for this year.

Chart 2

Our take: How the diverging policy expectations between the market and Fed get resolved boils down to the rhetorical glass half-full or glass half-empty question. Our expectation is the Fed will stop hiking rates in March after two more 25 basis point (0.25%) hikes and will be a positive catalyst for stock market performance in the coming year.

Topic 3: earnings

Bull case: Earnings fall less in inflationary environments because of revenue strength. Expectations are already very low. Companies have had plenty of time to prepare for the slowdown. U.S. dollar headwinds turning to tailwinds as the greenback heads lower.

Bear case: Margin pressures intensifying. Estimates likely still too high for a potential recession in 2023 when historically earnings have typically fallen about 10%. Contributions from energy are dwindling.

Background: As we discussed in our Q4 earnings season preview, expectations for earnings season for the quarter and 2023 are quite low. As supply chain pressures ease, growth in China picks up, inflation (likely) falls further, and the dollar potentially moves lower, companies will be in a better position to generate earnings growth in late 2023 and early 2024. Consumers still have money to spend. Margins will deteriorate further in the short-term but companies are taking steps to manage costs after preparing for recession for months now—especially the big banks as we have heard during their earnings reports. A return to prior decade norms is unlikely given the new higher profitability regime, backed by technology advances.

Estimates remain too high but are already coming down, as shown in Figure 3. The reduction in estimates for S&P 500 earnings this year from the 2022 peak is already in line with the long-term average of 10%. Estimates will come down further, but the pace of those reductions will likely slow after the bar is lowered again during the current earnings season.

chart 3

Our take: Markets may be pleasantly surprised by a modest, rather than significant, earnings decline in 2023 supported by strong revenue, cost controls, and a healthy U.S. consumer.  LPL Research expects earnings resilience to be supportive of stocks later this year.

Topic 4: China’s Reopening

Bull case: China’s reopening will help unsnarl global supply chains, driving global growth and helping ease inflation pressures. Stimulus measures will be supportive.

Bear case: China’s re-opening will be uneven and inflationary pressures will continue.

Background: After nearly three years of a stringent policy that closed down large and important parts of China, in what was called Zero-COVID-19 policy, Beijing has ordered the reopening. Although the COVID-19 virus continues to spread across the country, leading to a self-imposed voluntary lockdown, expectations are that by the second half of the year, the economy could begin to emerge from the serious economic decline wrought by strict lockdown measures. Supporting the economy, which is the world’s second largest, has become an important message from top Chinese leadership.

In addition, the government is enacting policies to help the beleaguered and debt-laden property development market. The totality of the property market accounts for nearly 25% of China’s economy. Comments regarding support for the private sector are of particular interest as that could help generate stronger growth for the overall economy, even if only marginally.

Moreover, government officials have stressed they want to ensure personal consumption, or personal spending, gains momentum following years of pent-up demand as fears of lockdowns dominated consumer activity.

Trade with China’s Asian partners is expected to improve, as is trade with traditional partners in Europe, particularly Germany, France, and Italy. With central banks continuing to raise rates in order to tackle inflation, and growing concerns about a slowing global economy, China’s emergence as a dominant presence in world trade would certainly help bolster prospects for a stronger global economic landscape.

Our take: China’s reopening is more bullish than bearish, but geopolitical tensions will remain a risk. We believe China-heavy emerging market equities are more of a trade than a long-term investment at this point.

Conclusion

LPL Research remains reluctant bulls but wary of the risks of further equity market volatility. Mild recession and modest earnings declines are likely already baked in the cake. Should the Fed pause after a March interest rate hike, the stage may be set for a nice stock market rebound on the back of falling inflation, reasonable valuations, and stable interest rates. Earnings may not be much of a catalyst this earnings season, but we see some of the pessimism turning into optimism as 2023 progresses.

The hotly contested bull-bear debate will continue early in 2023 and likely keep volatility elevated in the near term, but we expect these key risks to stocks to be largely resolved mid-year, setting the stage for stocks to make a run at our year-end fair value S&P 500 target of 4,400–4,500 by year-end.

Jeffrey Buchbinder, CFA, Chief Equity Strategist, LPL Financial

Quincy Krosby,PhD, Chief Global Strategist, LPL Financial

Jeffrey Roach, PhD, Chief Economist, LPL Financial

Adam Turnquist, CMT, Chief Technical Strategist

Fourth quarter earnings season is underway and probably won’t bring much good news. Lackluster global growth, ongoing profit margin pressures from inflation, and negative currency impacts are likely to translate into a year-over-year decline in S&P 500 Index earnings for the quarter. As always, guidance matters more as market participants look forward. The key question coming into this earnings season is whether the pessimism surrounding 2023 earnings has gone too far.

A number of headwinds

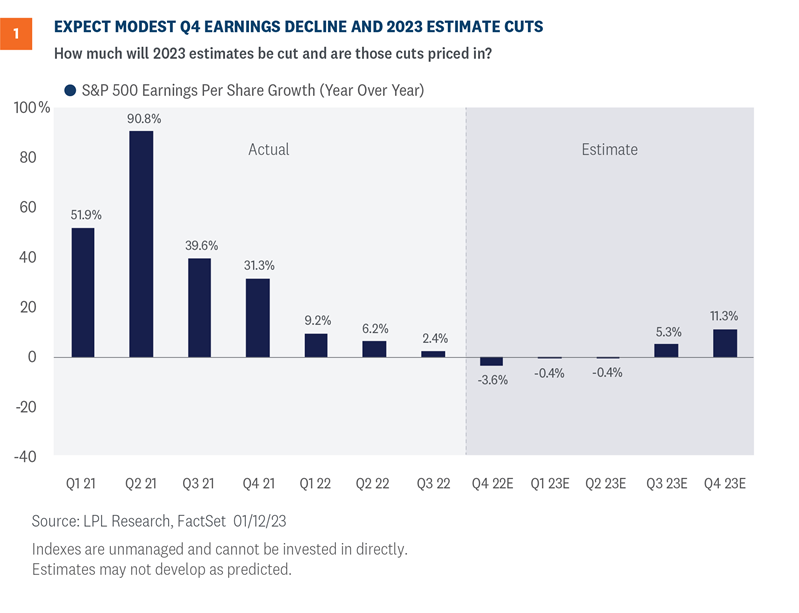
As was the case last quarter, corporate America faces several stiff headwinds this earnings season. These headwinds—clearly not new news—include slower global economic growth, cost pressures from still-elevated inflation, ongoing supply chain issues, currency drag from a stronger U.S. dollar last quarter compared with the year-ago quarter, and geopolitical instability, particularly in Eastern Europe and China. These headwinds will likely translate into a slight year-over-year (YOY) earnings decline for the S&P 500 in the fourth quarter, with an outside shot at getting above the flat line (Figure 1).Consensus currently stands at -3.6% YOY in the quarter (source: FactSet).

chart 1

The good news is some of these pressures have started to abate, particularly currency pressures, after a 9% drop in the U.S. dollar since the fourth quarter began on October 1 (though it was up about 6% YOY in Q4). Even the economic pressures have eased some, with fourth quarter U.S. gross domestic product (GDP) likely to exceed the 1.2% consensus forecast of economists surveyed by Bloomberg based on the latest data. And don’t forget the U.S. economy grew at a solid 3.2% pace in the third quarter of 2022, while Europe has held up better than we anticipated, thanks in large part to falling natural gas prices.

Bottom line, if we’re going to get enough upside for the S&P 500 to grow earnings at all in Q4, it will likely come from the resilience of the U.S. and European economies, currency effects, and some mitigation of profit margin pressures from cost controls and lower inflation.

Guidance is key

The key question to answer this earnings season is whether the pessimism surrounding 2023 earnings has gone too far. LPL Research believes that it probably has. Admittedly, analysts have been too slow to bring S&P 500 earnings estimates for 2023 down from the current $230 per share level to a more reasonable $215 to $220 range (our estimate is currently $220, flat or down slightly from 2022 levels). A mild recession would likely take us down to $210 or lower, depending on how fast and how much inflation comes down later this year.

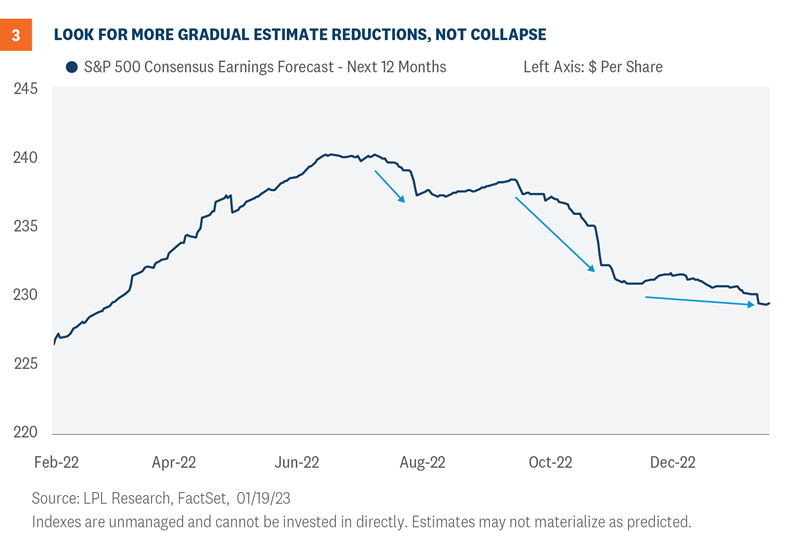
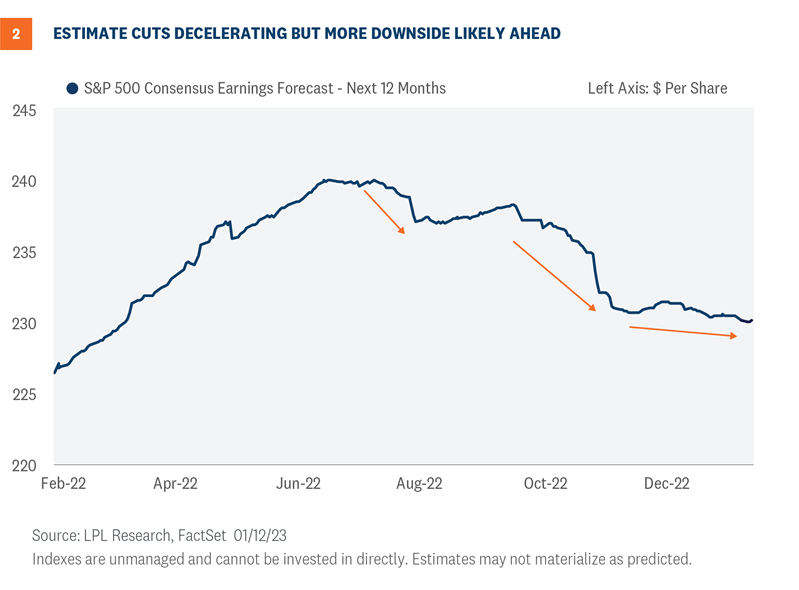
As shown in Figure 2, estimates have come down substantially over the past two quarters, but the pace of cuts has slowed heading into fourth quarter earnings season. That may indicate estimates may not have to come down 10%-plus in the near term as some market strategists expect.

Chart 2

Here are some reasons why estimate cuts may not be as drastic as some fear:

  • China’s reopening—uneven or not—is well underway and may be a catalyst for supply chain fixes and more global demand.
  • Companies have had plenty of time to prepare. If a recession occurs this year, it may be the most anticipated recession in history.
  • Cost pressures have started to ease, taking some of the pressure off margins. Examples include lower energy prices and slowing wage increases.
  • Recession may be a more than 50/50 proposition, but it isn’t inevitable. The U.S. economy may “muddle through” and skirt recession.
  • Revenue growth is solid, bolstered by the higher revenue that comes with inflation. Consensus is calling for a 3.8% YOY increase in fourth quarter S&P 500 revenue, but recent quarterly trends suggest a 5% increase is possible.

Pushing in the other direction is the 1–2% hit to S&P 500 earnings expected this year as a result of the tax increases in the Inflation Reduction Act (which, as we’ve shared in the past, won’t do much to lower inflation this year). Soft manufacturing activity and ongoing inventory adjustments in certain segments of the economy, such as semiconductors, will also be a drag on earnings in the near term.

Bottom line, we would look for 2023 earnings estimates to come down, but not collapse, this reporting season. The path to a sub-$220 number for S&P 500 EPS estimates this year, if we get there, will be gradual. Modest cuts in the coming weeks may actually be a positive catalyst for stock prices.

Pay attention to earnings season, revisions matter

With so much disagreement about the 2023 earnings outlook, maybe it’s not a tough sell to convince investors that earnings matter. We often hear analysts projecting the seemingly obvious “earnings matter” refrain; of course earnings and fundamentals matter, but at times of irrational exuberance—though not as much in 2022 and 2021—and meme stocks (see here), we feel the need to yell it even louder. Beyond the obvious reasons to pay attention during earnings season, there are quantitative trading trends that support paying attention to earnings, and more importantly, forward estimate revisions.

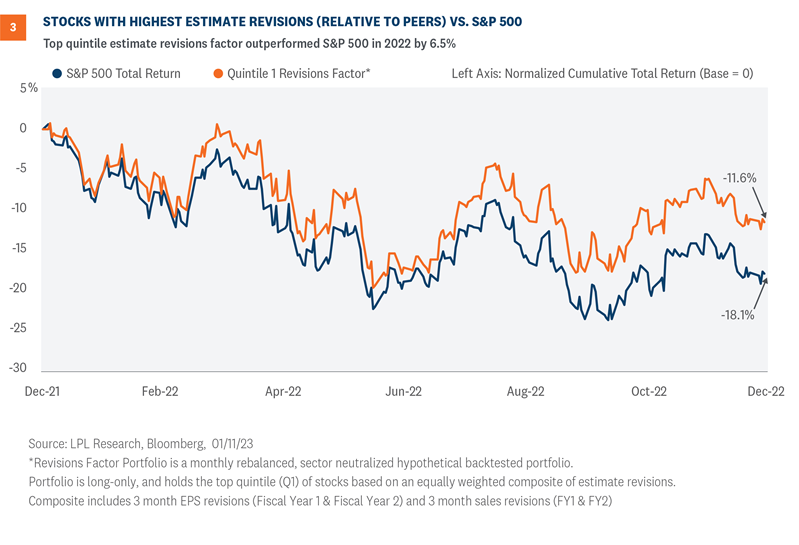
LPL Research’s quantitative research team created a revisions composite factor, which combines four estimate revisions metrics (current and following fiscal year EPS and sales estimate revisions over last three months) into one standardized score.

Using the S&P 500 as the investible universe, a hypothetical long-only portfolio is constructed of the top quintile (top 20 percent) of stocks’ estimate revisions composite score. This portfolio is equally weighted and rebalanced monthly. Looking at 2022 in isolation, this strategy would have outperformed by about 6.5% to 7%, depending on whether you neutralize sector effects or not.

Figure 3 shows the hypothetical performance of the sector-neutralized portfolio vs. the S&P 500 on a total return basis. We analyzed this phenomenon by sector, and while most sectors showed positive performance vs. their cap-weighted sector index, there were sectors that underperformed. This estimate revision phenomenon provides a compelling backdrop for fundamental stock picking and provides another tool for investors to use in equity and sector selection. 

chart 3

Conclusion

This earnings season likely won’t offer much in the way of good news. We saw that in the challenges the banks faced in their reports on Friday, January 13 (an inauspicious date to start earnings season). But pessimism may be overdone, and investors may be surprised at how well stocks hold up on the news. Look for earnings throughout the next year to exceed those pessimistic forecasts and—along with falling inflation and the end of Federal Reserve rate hikes—serve as positive catalysts for solid gains for stocks in 2023. 

Jeffrey Buchbinder, CFA, Chief Equity Strategist, LPL Financial

Thomas Shipp, CFA, Quantitative Equity Analyst

We believe accountability and modesty are among the keys to success in this business. In striving for those qualities, LPL Research has a tradition of starting off a new year with a lessons learned commentary. We got some things wrong last year, no doubt. But those who don’t learn from their mistakes are doomed to repeat them. Here are some of our lessons learned from 2022. As you might imagine, inflation and the Federal Reserve are common themes throughout.

Lessons learned: Economic forecasts

The Fed’s bark was as bad as its bite!

Investors have been carefully dissecting Federal Reserve (Fed) officials’ words for decades, and depending on the composition of the Federal Open Market Committee (FOMC), its bark is often worse than its bite. But this time was probably different. One of the lessons learned in 2022 was to never underestimate our central bank’s resolve to squelch inflation. Another corresponding teachable moment was never overestimate the speed of price declines.

At the start of 2022, markets expected the upper bound of the fed funds rate to stay below 1%. The expectation was predicated on the view that inflation pressures would ease as global economies recalibrated to a post-pandemic environment. But inflation was stickier than anyone anticipated, and the inflation dynamics were further exacerbated by Russia’s invasion of Ukraine and COVID-19-related lockdowns in China. As inflation accelerated in early 2022, especially housing prices, members of the FOMC started warning investors about the need for aggressive action to fight inflation.

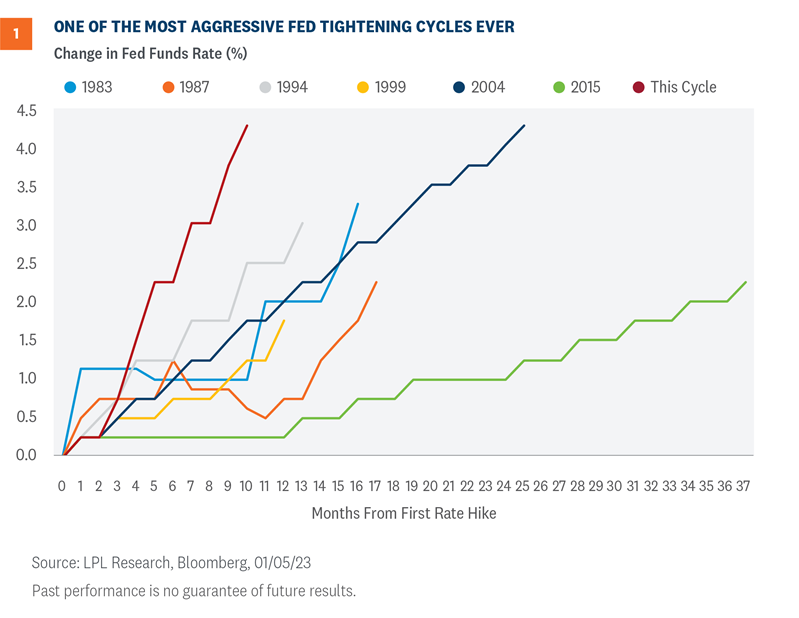
As shown in Figure 1, policy response was as aggressive as policymakers’ speeches. Policy makers were more intent on tightening financial conditions than virtually anyone anticipated. Investors have never seen four consecutive 75 basis point (0.75%) rate increases by the FOMC since the Fed started explicitly targeting the fed funds rate to implement monetary policy. 

chart 1

These lessons learned from 2022 are particularly important for 2023 since FOMC members expect rates in 12 months to be higher than what investors are currently expecting. Caveat emptor.

Lessons learned: Equity Market forecasts

Stock market impact from gradual hikes is very different than impact from steep hikes

Entering 2022, the LPL Research team agreed with the Fed that there was a path to a soft landing, despite high inflation. A soft landing is still possible at this point, but the path has narrowed a lot over the past six months or so given the aggressive Fed response to last year’s inflation surge.

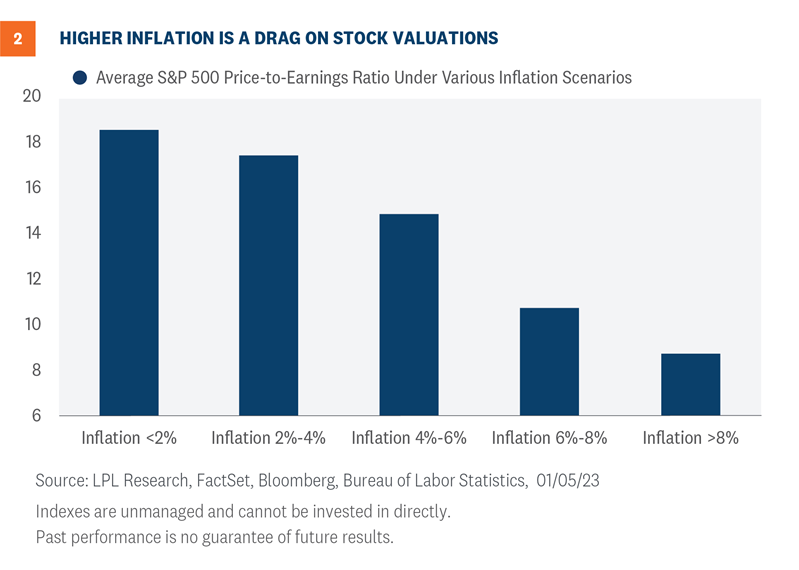
When LPL Research released the Outlook 2022: Passing the Baton in December 2021, the team’s view was that the hit from inflation would be manageable and would therefore limit the number and magnitude of interest rate increases, enable the U.S. economy to avoid recession, and support above-average valuations. Well, the hit from inflation was worse than we anticipated, the Fed was surprisingly aggressive (central bankers were clearly too slow in recognizing the severity of the inflation problem), and interest rates spiked well above our initial forecast. The relationship between inflation and stock valuations is a strong one, as shown in Figure 2, which meant the market could no longer support price-to-earnings (P/E) ratios over 20 (the same goes for the relationship between interest rates and stock valuations). The hit to valuations in the form of about 4 P/E points (21 to 17) translates into a roughly 20% drop in the S&P 500 Index. 

Chart 2

While our team underestimated inflation and the resulting hit to valuations last year, there were some wins. LPL Research’s $220 S&P 500 earnings per share forecast at the start of the year looks spot on—consensus is now calling for $220.30 for 2022, with the fourth quarter yet to be reported. And on the asset allocation side, the team’s preference for value stocks throughout the year turned out to be a win.

Lessons learned: Bond Market forecasts

Relying on history doesn’t always work

Coming into 2022, we had the expectation that interest rates would rise from very low levels, but we thought the rise in rates would be gradual. At the start of the year, we assumed the Fed would take a gradual approach to removing the very accommodative monetary policy that had been in place, frankly, since the end of the global financial crisis. The reason? The last few rate hiking campaigns were very slow and deliberate. If you look back at the rate hiking campaign that began in 2015, for example, the Fed raised interest rates by 0.25% in December 2015 and didn’t hike rates again until December 2016. Moreover, if you look at the rate hiking campaign that began in 2004, the Fed didn’t actually get to its terminal rate until 2006—a full two years after it started. However, what transpired over the course of 2022 turned out to be the most aggressive rate hiking campaign in four decades.

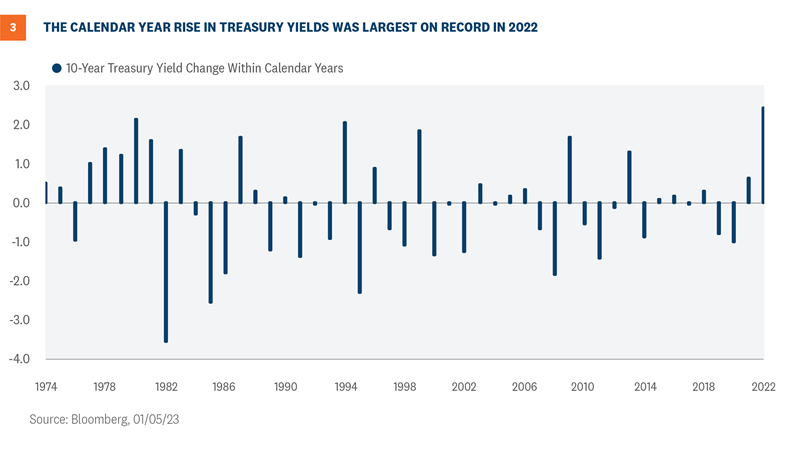
Because of that aggressive rate hiking campaign that took place largely in one calendar year, we saw Treasury yields increase the most in one calendar year on record. The chart below shows the changes in the 10-year Treasury yield on a calendar basis and the 2.4% increase in yield last year was more than any calendar year period on record; even during the 1970s and 1980s when interest rates were significantly higher than today. That upward pressure on yields certainly caused fixed rate coupon paying bonds to sell off dramatically last year, resulting in the worst year on record for core bonds (as measured by the Bloomberg Aggregate Bond Index).

chart 3

Conclusion

LPL Research had some hits and misses in 2022, no doubt. As always, we try to learn from the misses while still recognizing the hits. After underestimating the inflation surge last year, the Fed and markets may be erring on the other side this year. The forces now pushing down on inflation are getting stronger, which may keep interest rates down and stock valuations supported this year. Here’s hoping for more hits and fewer misses for all of us in 2023.

Jeffrey Buchbinder, CFA, Chief Equity Strategist, LPL Financial

Lawrence Gillum, CFA, Fixed Income Strategist, LPL Financial

Jeffrey Roach, PhD, Chief Economist, LPL Financial

2022 was a dizzying year as markets and the global economy continued to find itself out of balance due to the still present aftereffects of the COVID-19 pandemic and the policy response to it. If 2022 was about recognizing imbalances that had built in the economy and starting to address them, we believe 2023 will be about setting ourselves up for what comes next as the economy and markets find their way back to steadier ground. The process of finding balance may continue to be challenging and we may even see a recession, but underlying fundamentals could create opportunities in stock and bond markets that were difficult to find in 2022.

This commentary contains excerpts from LPL Research’s Outlook 2023: Finding Balance.

Outlook – Economy

The global economy will likely slow from the upper-2% range in 2022 down to the mid-1% range in 2023 [Figure 1]. Much depends on China’s growth path now that it has largely abandoned its overzealous zero-COVID-19 policy. An important aspect for investors is that the U.S. appears to have fewer headwinds to growth compared with Europe and other developed economies. The divergence between the domestic and international economies is most obvious in the inflation regime. Germany, for example, is still experiencing accelerating rates of inflation, whereas the U.S. has likely moved past the peak. The longer inflation is uncontained, the riskier the growth prospects.

If the U.S. falls into recession, the chances are it would occur during the first half of 2023 and will not likely be as deep as the 2008 recession, which was initiated by a fundamentally flawed financial market.

chart 1

More Clarity on Potential for U.S. Recession

One reason we’re currently seeing a healthy debate on the likelihood of a recession is that for most of 2022, not all of the metrics that typically precede recessions were flashing warning signs. However, recent data may give us more clarity. The Conference Board’s Leading Economic Index (LEI), an aggregate of indicators that tend to lead economic activity, is now in an extended decline, showing the economy could enter a period of significant and broad-based contraction. The decline is predictable as many sectors, such as housing, started slowing months ago. Since the inception of the LEI, a decline of the current magnitude over a six-month period has always foreshadowed a recession in subsequent quarters. As such, we think recession risks appear more probable by the beginning of 2023. If the economy does fall into a recession, the cause will likely be from the consumer sector retrenching after years of inflationary pressures, high housing costs, and slow real wage growth.

Inflation Should Become Convincingly Softer

Investors and central bankers will likely enter 2023 with a slightly different trajectory for inflation, particularly services inflation. In recent months, durable goods prices have clearly decelerated—and in some cases, outright declined—but services prices have been stubbornly accelerating as rent prices and health services rose. We could potentially be entering a new regime as rents across the country are showing signs of abating. During this transition period for services prices, the coming year could be the time when inflation is convincingly decelerating closer to the Federal Reserve’s (Fed) long-run target of 2%.

If inflation in 2022 was about supply constraints, then inflation in 2023 could center on demand constraints. For the past year, supply-related problems contributed more to inflation than demand-related imbalances. China’s zero-COVID-19 policy was one of the biggest glitches in supply chains, as metro areas and ports were shuttered by the Chinese government. However, things may be on the verge of changing as supply and demand get into balance throughout 2023, and as inflation likely becomes more demand driven and less supply driven. This is positive for policymakers because monetary policy tools do not work on supply shocks but rather, only on demand; thus, these tools are now more relevant than they were when inflation was primarily from supply bottlenecks. So as supply constraints ease and as Fed tools become more impactful, we could see the rate of inflation decelerating further in 2023.

Outlook – Stocks

Equity markets lacked balance in 2022 as the challenging macro environment overwhelmed business fundamentals. Stubbornly high inflation and sharply higher interest rates were the dominant market drivers, pressuring valuations and inciting fears of recession and falling corporate profits. In 2023, we look to equity markets to find a better balance between key macroeconomic factors—inflation, interest rates, and Fed policy—and business fundamentals.

Reaching the Peak of the Rate Climb

If stocks are going to go higher in 2023, a prompt end to the Fed’s rate hiking campaign will likely be a key component. Our base case is the Fed will pause in early spring of 2023 amid an improving inflation outlook and loosening job market. Should that occur, stocks would likely move higher, consistent with history. Stocks have tended to produce solid gains after hiking cycles end, including a 10% average gain one year later.

What Goes Down Tends to Go Up

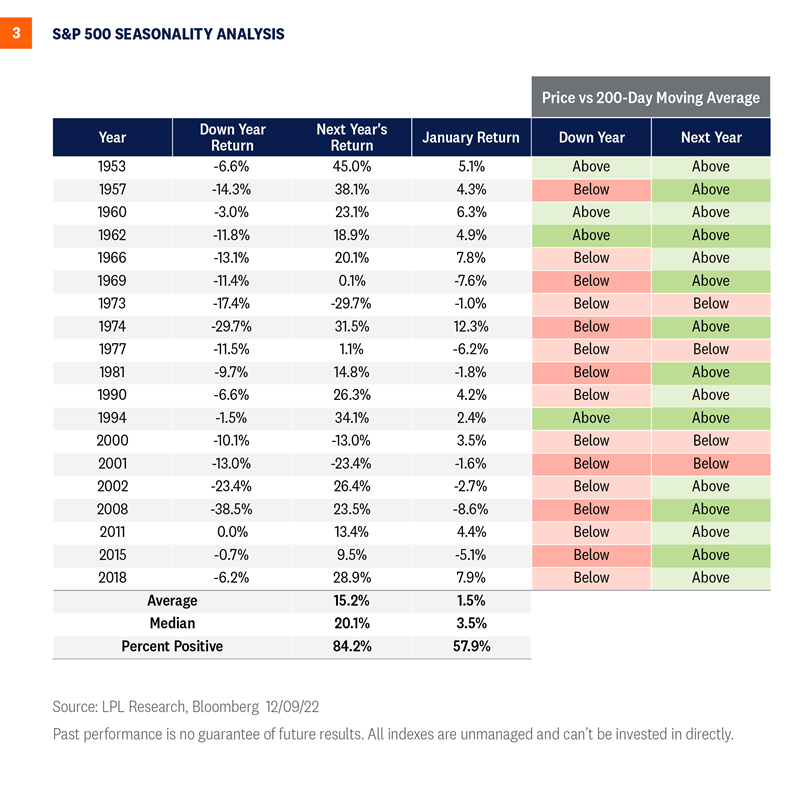
They say what goes up must come down. For the stock market, it also works the other way. Through many economic downturns, recessions, and geopolitical crises over many decades, the stock market has always recovered. Those patient and courageous investors who were able to take advantage of those declines have usually been rewarded nicely. Following down years, the S&P 500 Index (S&P 500) has risen an average of 15%, with positive returns in 15 out of 18 years. Since 1950, a down year was only followed by another down year three times: in 1973, 2000, and 2001.

Looking at this another way, after losing 20% or more at any point in time, the S&P 500  has gained an average of 17.6% over the subsequent 12 months (monthly data). The positive post-midterm election year pattern provides another historical analog that should be supportive of higher stock prices in 2023.

Wide Range of Possible Earnings Outcomes

Corporate America faces significant headwinds as 2023 gets underway. Cost pressures amid high inflation and still-snarled global supply chains are the biggest factors, but slowing economic growth and the strong U.S. dollar may make any earnings growth in 2023 difficult to achieve. Many companies over-earned during the pandemic, so some reversion back to normal still needs to occur. Inventories also need to be brought down. Even though some of these pressures have started to ease, lower commodity prices and slightly looser labor markets have, thus far, had limited impact on inflation overall.

Our base case for S&P 500 earnings per share in 2023 is $220, similar to where 2022 is tracking and well below consensus ($230.66 as of December 29, 2022). Revenue will continue to get a boost from inflation, as many blue chip companies during third quarter earnings season demonstrated an ability to pass along higher prices due to their pricing power. But margins will likely compress further over the next several quarters before support from lower costs potentially arrives.

An upside scenario could materialize if inflation falls faster than we anticipate, propping up margins and potentially putting S&P 500 earnings per share as high as $235 in 2023 and over $250 in 2024. On the other hand, stubbornly high inflation and a more prolonged economic downturn could introduce downside risk, possibly down to $200 per share in earnings in 2023 before a potential rebound to $230 in 2024.

Tilting the Scales Back in Favor

In 2022, the bear market decline in stocks was all about the macro picture—high inflation, surging interest rates, and rising recession risks. Strong consumer and corporate balance sheets and growth in corporate profits were not rewarded by investors, who were focused on rising recession risk and concerns of higher interest rate levels affecting future earnings. Add to that a tense geopolitical landscape and a strong U.S. dollar, and stocks struggled to make any headway throughout the year.

Looking ahead to 2023, stock drivers are likely to be more balanced. Rather than the scales tilting toward rising interest rates and runaway inflation, we may see falling interest rates and lower inflation supporting higher stock valuations. Should the outlooks for economic growth and inflation improve as 2023 progresses, stocks may also get a lift from prospects for stronger earnings growth in 2024.

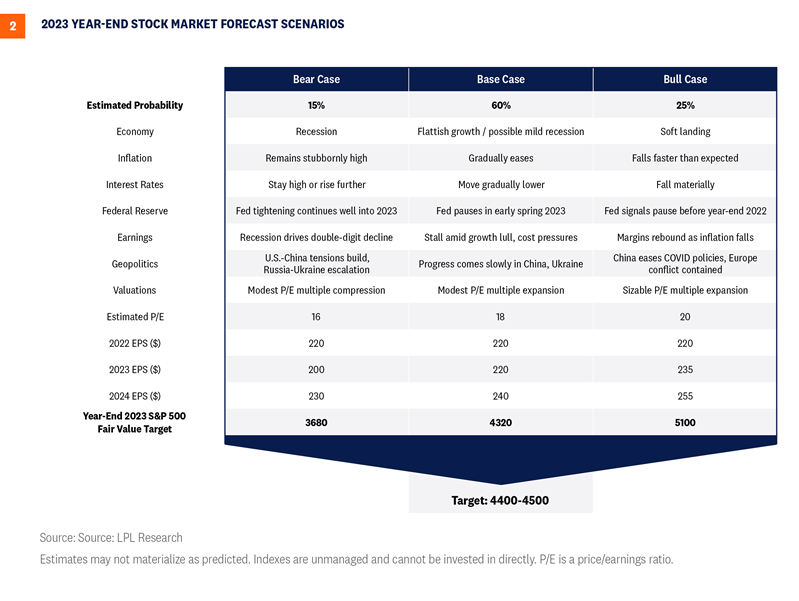
LPL Research’s Strategic and Tactical Asset Allocation Committee (STAAC) sees fair value for the S&P 500 at 4,400–4,500 at year-end 2023, based on a price-to-earnings ratio of 18–19 and $240 per share in S&P 500 earnings in 2024. That target is also derived from probability-weighted scenarios and based on various paths for the economy, inflation, interest rates, and earnings [Figure 2].

Chart 2

We look for stocks to find better balance between the macro environment and business fundamentals in 2023, tilting the scales toward the bulls.

Outlook – Bonds

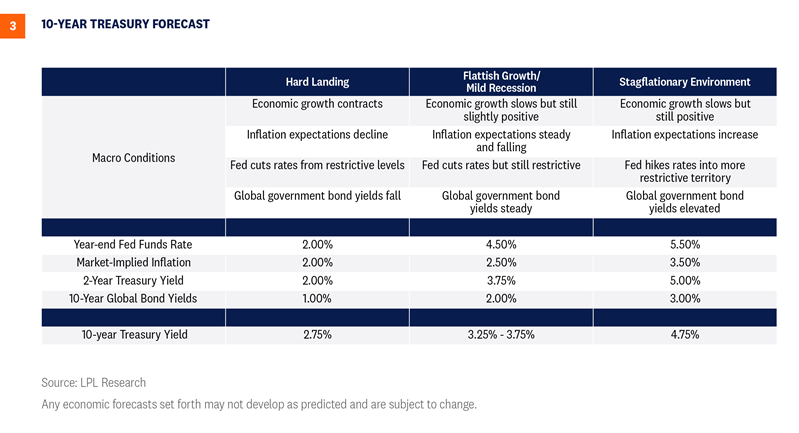
The path of interest rates in 2023 will largely be influenced by the Fed’s behavior, which will be guided by economic growth and inflation data. Equally important is the level of non-U.S. developed government bond yields, as foreign investors are an important buyer of U.S. Treasuries. Higher foreign market yields, all else equal, generally dissuade foreign investment into our markets. There are a range of scenarios we think could play out over the year. However, given our view that the U.S. economy could eke out slightly positive economic growth in 2023, we think 10-year Treasury yields could end the year around 3.5% [Figure 3].

chart 3

The Road to Recovery for Core Bonds

The core bond index (as defined by the Bloomberg Aggregate Bond Index) has seen losses in 2022 unlike any year since its inception. But because bonds are both financial instruments and financial obligations, which pay coupons and principal repayments at par when they mature, the potential for recovery is a bit more certain than in the equity markets that rely primarily on price appreciation. So, how long will it take to recover this year’s losses?

If interest rates don’t change at all, the best expectation for performance over the next year would be the index’s starting yield, which sat at approximately 4.7% on December 28. But if interest rates decline by 0.5%, the Bloomberg Aggregate Bond Index could return more than 8% over the next 12 months. Moreover, if interest rates move back into the low 3% range, the core bond index could return around 11% over the next year. Also, and importantly, given where starting yields are, if interest rates increase by another 1% from current levels, fixed income markets broadly could still generate positive returns over the next 12 months. Given the move higher in yields we have experienced this year, we think the risk/reward for owning core bonds has improved.

However, for investors that don’t want to take on a lot of interest rate risk, the opportunity set in shorter maturity fixed income securities has improved as well. With 1- and 2-year Treasury securities both yielding above 4%, cash and cash-like instruments finally offer an attractive yield. Moreover, shorter maturity investment grade corporate securities are offering yields in line with longer maturity corporate credit securities—without the same level of interest rate or credit risk.

One thing to consider is that because starting yields are the best predictor of future returns over the maturity of a fixed income instrument, by taking on that additional interest rate risk and owning a full market core bond portfolio, investors would be “locking in” investments at higher yields for a longer period of time. If interest rates do fall from current levels, investors that are in shorter maturity securities would then have to reinvest proceeds at lower rate levels.

So for investors with an investment time horizon greater than five years, a full market core bond portfolio may make sense. Otherwise, shorter maturity securities offer attractive yields as well. Bottom line, after the back-up in yields in 2022, there are a number of attractive fixed income opportunities again.

What’s Next for Corporate Credit?

Since Treasury yields are generally used as the base rate for consumer and corporate borrowers, this year’s increase in Treasury yields pushed many borrower’s borrowing costs to levels not seen in years. For corporate borrowers, after years of borrowing at ultra-low rates, the backup in yields we’ve seen this year has pushed corporate borrowing rates back above 5%, which is meaningfully higher than the 2% levels many borrowers enjoyed in 2020 and 2021. Could higher borrowing costs for corporates reduce profitability and potential growth opportunities?

Perhaps, but over the last two years in particular, corporate borrowers have increased the amount of new debt issued seemingly to prepare for the rising rate environment we’re currently facing. In fact, new corporate debt issuance for investment grade companies hit record highs in 2020 and 2021, when over $3 trillion of new debt was issued. As such, corporate entities were able to term out debt by issuing a lot of debt at longer maturities and lower rates. Also, and notably, because companies were able to refinance existing debts over the last few years and push out maturities, only about 1% of existing debt needs to be refinanced in 2023, and less than 10% needs to be refinanced before 2025. So the need for companies to refinance existing debt at these higher levels seems to be currently muted. 

That said, if the Fed is able to keep rates at these elevated levels, and as the need for corporate borrowers to access the capital markets increases, there’s no doubt corporate profitability will be negatively impacted by higher interest expenses. However, we don’t think it will happen in the near term.

LPL Financial Strategic and Tactical Asset Allocation Committee

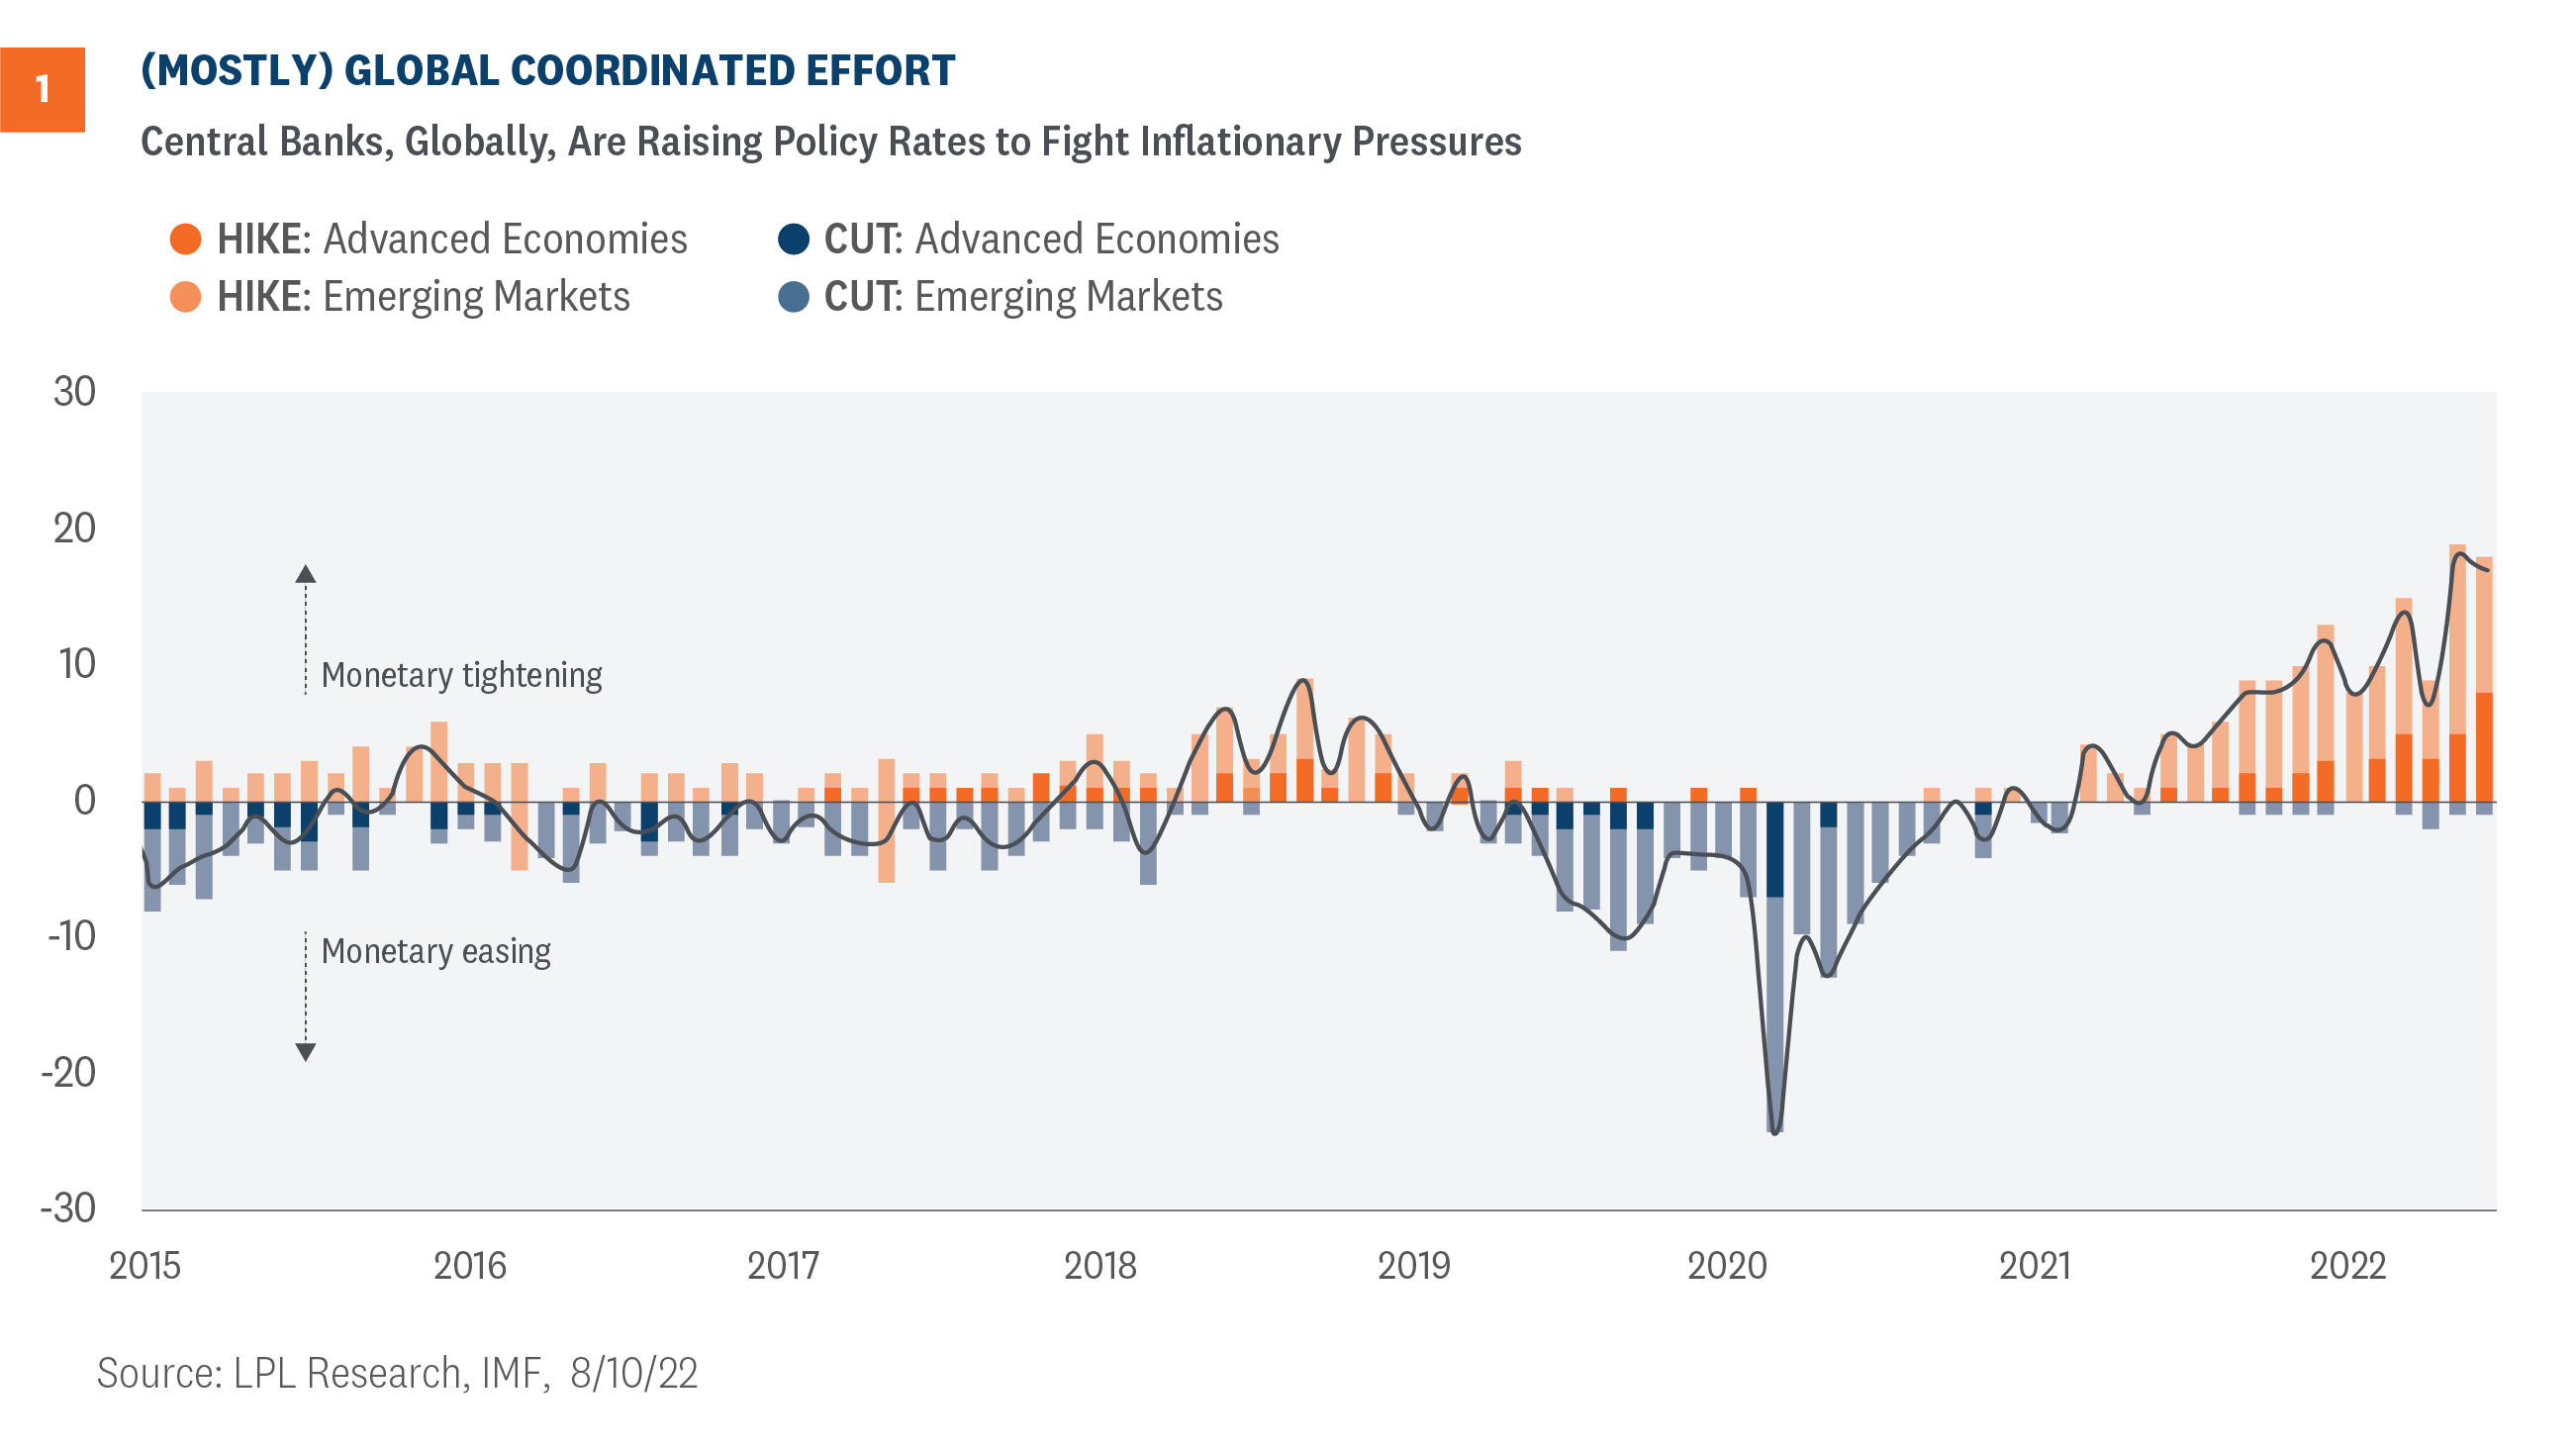
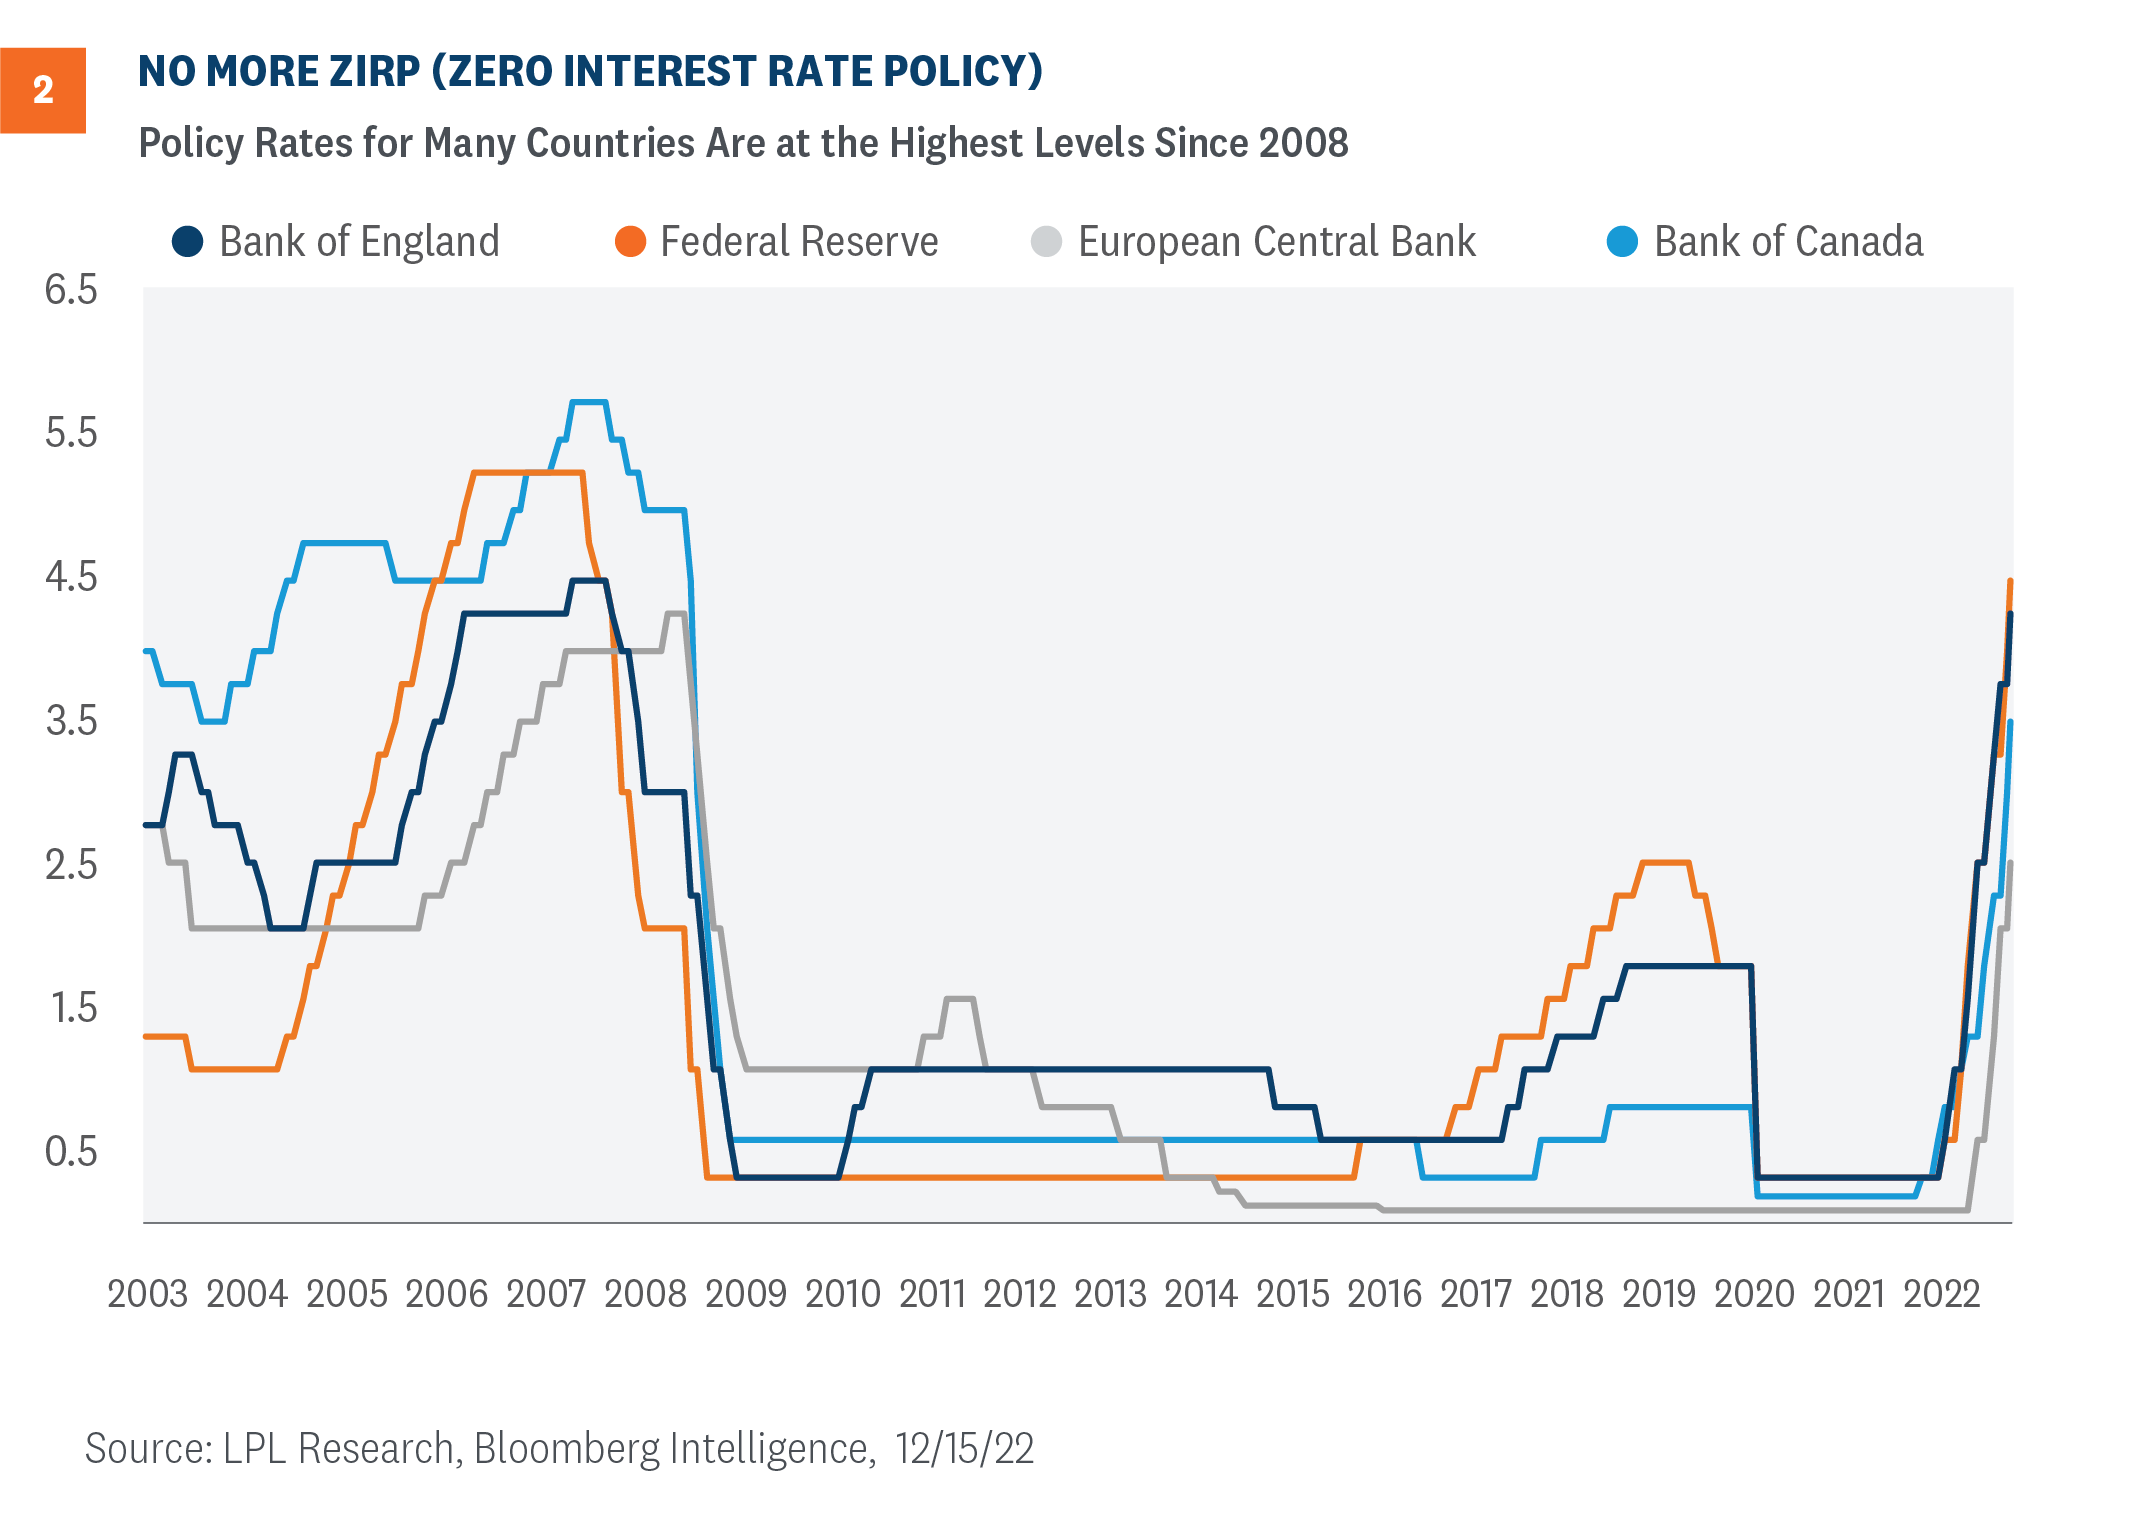
The Federal Reserve (Fed) wrapped up its last Federal Open Market Committee (FOMC) meeting of the year last week, where it hiked short-term interest rates for the seventh time in as many meetings, taking the fed funds rate to 4.5% (upper bound). A day later, both the European Central Bank (ECB) and the Bank of England (BoE) also hiked interest rates, taking their respective policy rates to the highest levels since 2008. Over 90% of central banks have hiked interest rates this year, making the (mostly) global coordinated effort unprecedented. The good news? We think we’re close to the end of these rate hiking cycles, which could lessen the headwind we’ve seen on global financial markets this year.

(Mostly) Global Coordinated Effort

With the Fed’s 0.50% rate hike last week, it capped a year in which the FOMC raised short-term interest rates at the fastest clip in four decades. Moreover, the magnitude of rate hikes brought the fed funds rate to its highest levels in over a decade. But it wasn’t just the Fed playing catch-up—central banks globally are following suit and raising policy rates in an attempt to arrest the highest consumer price increases since the 1980s. These are “mostly” coordinated because some central banks, such as the ECB, did not start raising rates until four months after the Fed started hiking. As seen in Figure 1, the level of monetary tightening, which began with many emerging market economies, is at a scale not seen in decades. 

chart 1

So how aggressive has the global rate hiking campaign been this year? After last week, there have been over 280 0.25% rate increases (for some context, if the Fed raises rates by 0.75%, that counts as three rate hikes), which translates into a cumulative 70% increase in policy rates. Additionally, more than 50 central banks have raised its policy rate by 0.75% a clip in 2022. Prior to this year, the Fed had only raised the fed funds rate by 0.75% one other time since the 1990s. It raised the fed funds rate by 0.75% at four consecutive meetings this year. Finally, according to Bloomberg Economics, the global GDP weighted average policy rate began the year at 2.8% and is likely to end the year at 5.2%. The 5.2% rate would be the highest in decades.

There are two notable central banks not following suit, at least not yet. The Bank of Japan (BoJ) and the People’s Bank of China (PBoC) have either held rates at current levels or cut rates. The PBoC has marginally cut rates throughout 2022 to offset slowing economic growth from intense zero-COVID-19 policies. While Japan has steadfastly maintained accommodative monetary policy this year, the BoJ will perform a policy review in the coming year. With the current governor retiring in April, it could join the rest of global central banks and start removing stimulus now that inflation in Japan is above target. Stranger things have happened.

No More ZIRP (Zero Interest Rate Policy)?

Because of the Global Financial Crisis and subsequent “great recession,” policy rates for many countries have stayed at near-zero levels for many years. While there was an effort to raise short-term interest rates towards the latter half of the last decade, central banks were forced to cut rates back to zero due to COVID-19. Over the past nine months though, central banks have raised interest rates, in many cases back to levels last seen in 2008 (Figure 2). In a matter of months, many central banks have effectively unwound over a decade of zero interest rate policy. The rapid increase in interest rates will make new debt for companies, consumers, and countries much more expensive. If interest rates stay at these elevated levels—a big if indeed—the era of cheap money would officially be over. 

Chart 2

More work to do?

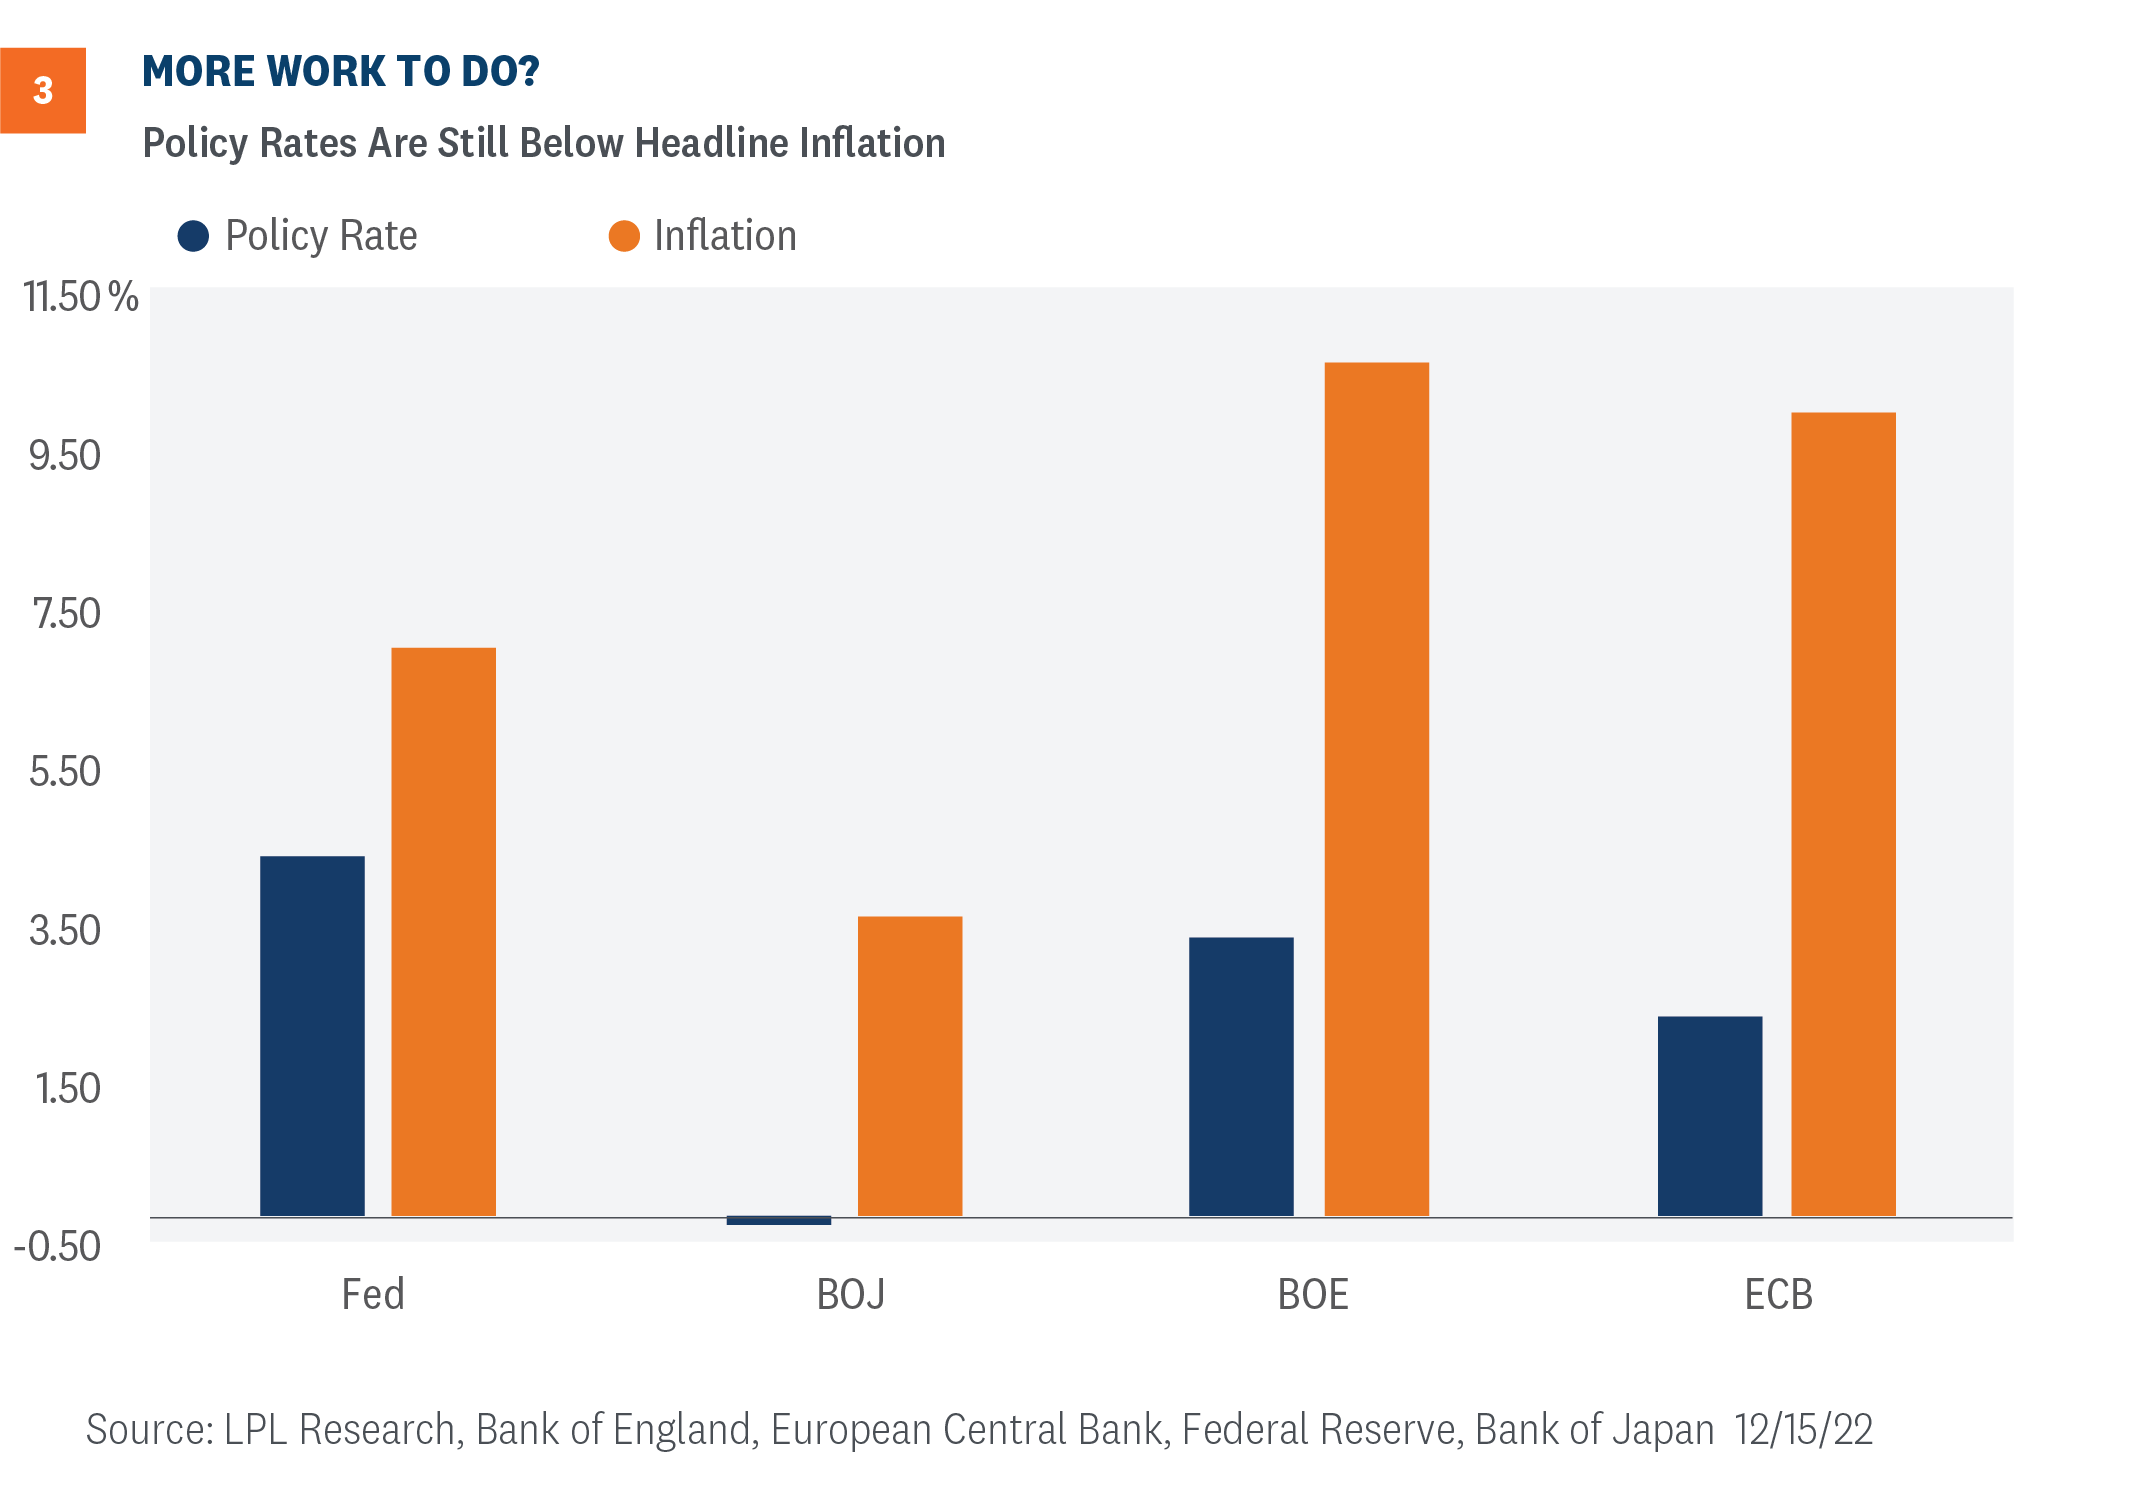
The Fed has been the most aggressive in tightening compared to the ECB and BoE, yet U.S. inflation is the lowest among these big three (Figure 3). It would seem the Fed is most intent on fighting inflation. These three have intimated that rates will climb higher from here, but markets may not fully believe the magnitude of increases. According to the latest dot plot, the Fed has to convince traders that the Fed is serious. Or maybe more likely, traders know the Fed has a penchant for forecast revisions, so we should not be surprised if the Fed revises the expected peak fed funds rate as inflation, including the sticky components, starts to moderate. It should be noted that, as Milton Friedman stated many years ago, policy rate hikes act only after a long and variable lag, so there is a risk the Fed, at least, has already hiked rates to fairly restrictive levels. However, it seems that the BoE and ECB likely have more work to do to bring down inflationary pressures. And the BoJ? As mentioned, it could start removing stimulus now that inflation in Japan is above target.

chart 3

What’s Next?

After a dizzying year of rate increases, central banks acknowledge there is still more work to do. As such, the beginning of 2023 will likely bring still higher short-term interest rates. In the U.S., the Fed’s recent dot plot, which is the individual committee member’s expectations of where the fed funds rate will end each of the next few years, shows committee members expect the upper bound of the fed funds rate to approach 5.25% at the end of 2023 and to remain restrictive for some time. That means the Fed still expects to raise rates by at least another 0.75%, and it could be several quarters before rate cuts take place. The other major central banks have had a similar message. However, we think most of the rate increases have either already taken place or been (mostly) priced into market’s expectations at this point. And the slower pace of rate hikes is unlikely to roil financial markets like they have this year.

So what’s after rate hikes? At the onset of COVID-19, central banks globally engaged in quantitative easing in which they bought large amounts of various financial instruments to ensure the smooth functioning of financial markets. We saw the size of central bank balance sheets increase by $10 trillion and are currently at $25 trillion for the Fed, BoJ, ECB, and BoE combined. However, these same central banks are set to reverse course and shrink balance sheets to get closer to pre-pandemic levels. As such, balance sheet runoff, colloquially titled quantitative tightening (QT), is taking place in the background but could be a much bigger story in 2023.

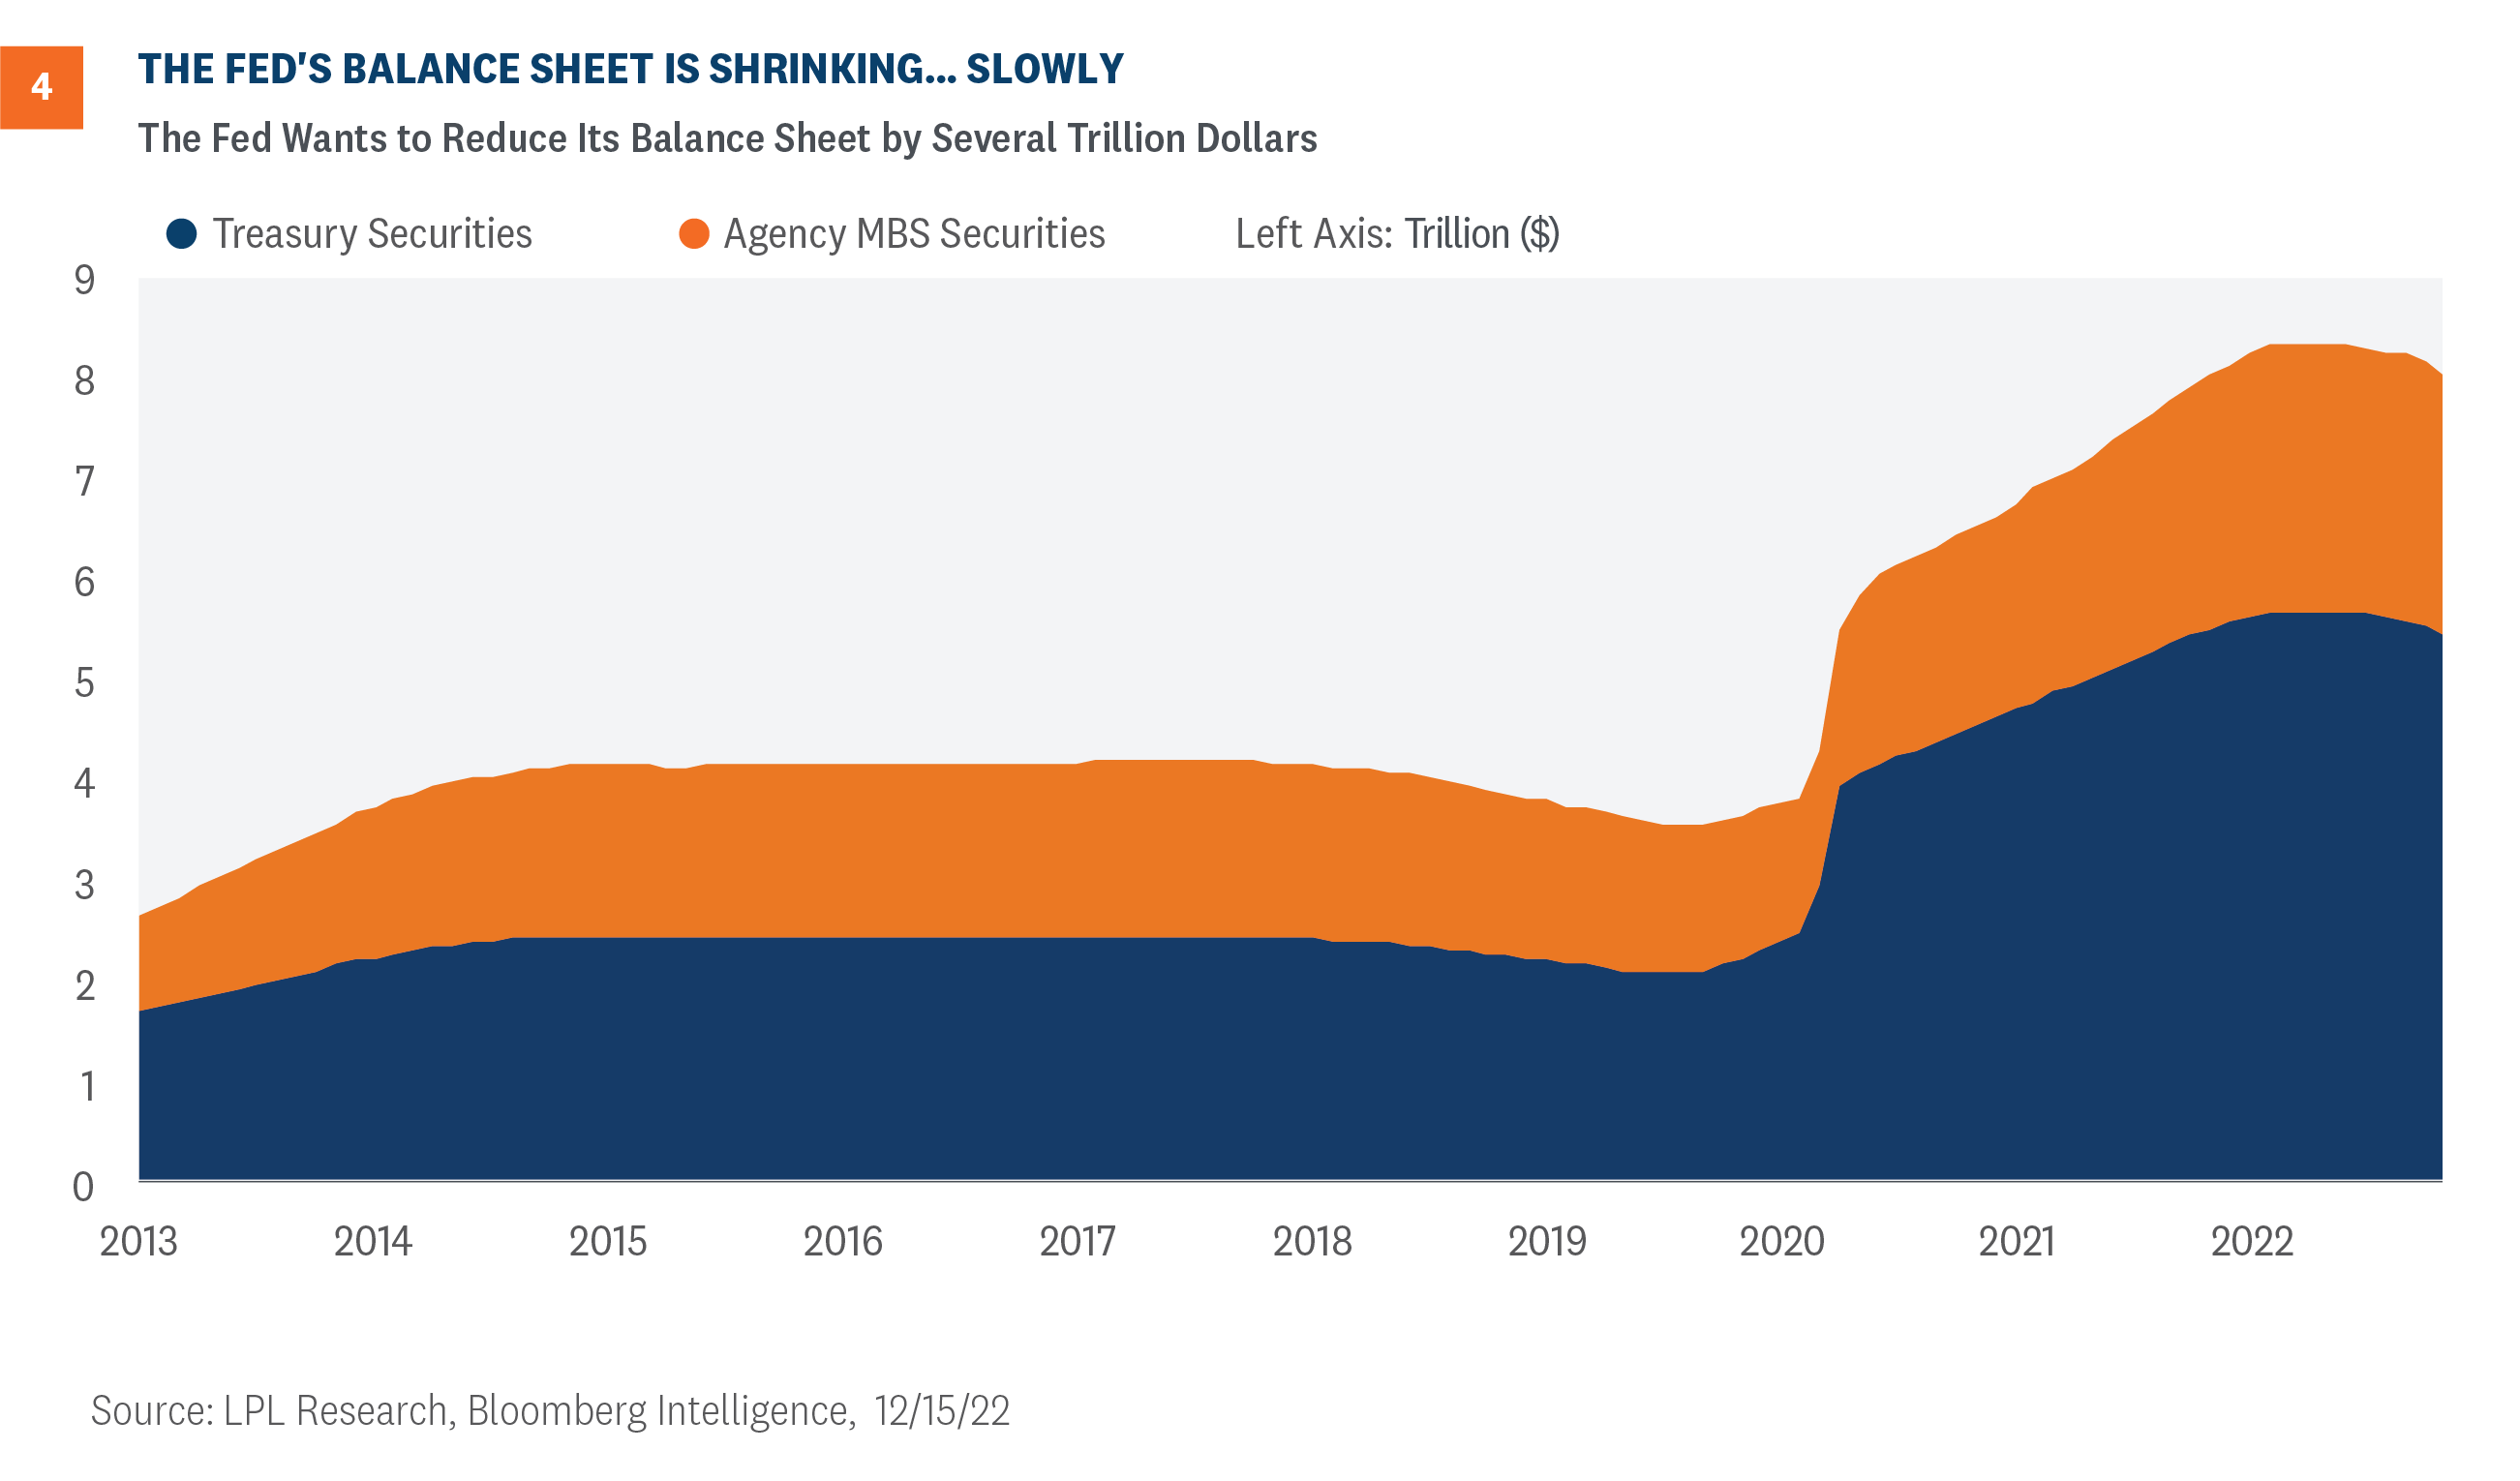
In the U.S., the Fed’s balance sheet got close to $9 trillion (Figure 4), or 40% of U.S. GDP, and the Fed wants to get that number closer to 20% of GDP. So, the Fed would like to shrink its balance sheet by several trillion. Currently, its balance sheet is shrinking by approximately $85 billion a month through the organic maturing of bonds. The Fed is not currently selling bonds but potentially could if it wanted to speed up the process. At the current pace though, the Fed could conceivably shrink its balance sheet by $2 trillion by the end of 2024. 

chart 4

What is the likely impact of QT? Frankly, the Fed isn’t exactly sure—this has only happened one other time. According to FOMC member Chris Waller, balance sheet runoff is equivalent to around “a couple of 25-basis point rate hikes.” Moreover, a paper from the Atlanta Fed says a “$2.2 trillion passive roll-off of nominal Treasury securities from the Federal Reserve’s balance sheet over three years is equivalent to an increase of 29 basis points in the current federal funds rate at normal times, but 74 basis points during turbulent periods.” Quite the range of potential outcomes. As such, we could see QT garnering more attention in 2023. That said, the Fed has the flexibility to amend the pace of runoff if the impact on financial markets becomes too deleterious.

Conclusion

Many financial markets are on pace for their worst year in quite some time, or in the case of core bonds, the worst year since inception of the core bond index (1976). With inflationary pressures running much hotter than central bank targets, many central banks were forced to respond by raising policy rates at a speed and magnitude unlike any other year. Certainly, the upward pressure on short-term interest rates was a major cause of the repricing of most financial assets this year. However, we’re starting to see positive signs of inflationary pressures easing, so it is likely that central banks can step down the pace and magnitude of rate hikes in 2023 and perhaps pause rate hikes. While we don’t think monetary policy will become accommodative anytime soon—absent a financial crisis or deep recession, which isn’t our base case—the central bank headwind that took place in 2022 may not be as strong in 2023, which could help many financial markets in 2023. 

Lawrence Gillum, CFA, Fixed Income Strategist, LPL Financial

Jeffrey Roach, Ph.D. Chief Economist, LPL Financial

Despite the S&P 500 Index starting December with five consecutive days of losses, we think December is down but not out. December often starts slow but historically has been a strong month. There are also some potentially supportive seasonal patterns ahead, such as the Santa Claus Rally, the outlook for January following down years, and the third year of the presidential cycle. ‘Tis the season, and this week LPL Research looks at some important seasonal patterns as the year winds down.

Slow Start to December Not Yet Bucking the Positive Seasonal Pattern

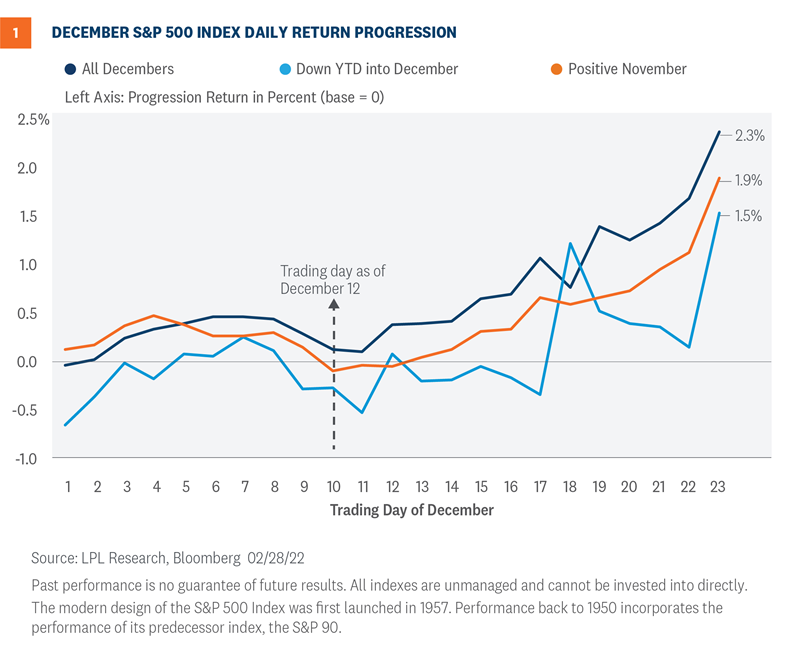
December is off to a rough start, and so far it’s not living up to its seasonal reputation of being one of the best months for equity market returns. Since 1950, the S&P 500 has historically produced average returns of just over 1.5% and has finished the month in positive territory 75% of the time. While the index is down as of Friday, December 9, seasonality trends point to a potential second-half recovery during the month.

As seen in Figure 1, despite the positive seasonal pattern, it’s not unusual for December to get off to a slow start. In fact, we’re near the low point for the historical pattern, and most gains have typically taken place in the second half of the month, although there’s a lot of variation from year to year.

chart 1 consumers were active on black friday

Figure 1 also highlights some added factors that apply specifically to this year, such as how December looks when we’re down year to date as we enter the month and what December looks like after a positive November. Both factors temper our enthusiasm for December strength, but December remains above average even when taking these factors into account.

Santa’s Helper

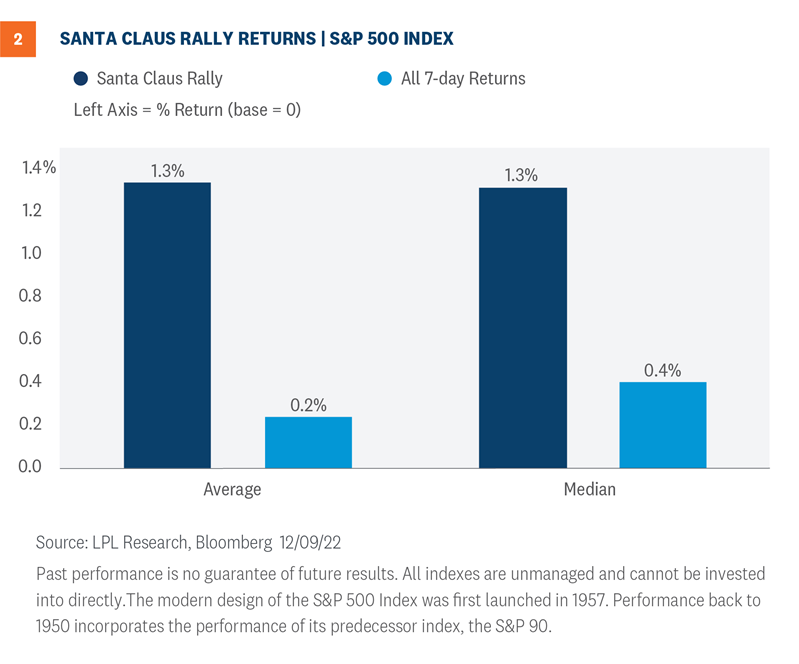
Part of the strong second-half December story is attributable to the market’s tendency to advance during the final trading days of the year and early into the next. This unique seasonal pattern was first discovered by Yale Hirsch in 1972. Hirsch, creator of the Stock Trader’s Almanac, termed the period the “Santa Claus Rally”, which he specifically defined as the last five trading days of the year plus the first two trading days of the new year. The period of just seven trading days is very short, but has historically provided a return comparable to a strong month [Figure 2]. It’s not unusual for stocks to move up (or down) more than one percent even in a single day, but having solid numbers over such a long time period may be meaningful. In any given year, it’s going to be more important factors, such as the economy and the policy environment, that drive returns. However, behind the scenes this period of relatively light volume does seem to provide added support.

Chart 2

Retail Stocks Not as Resilient as Consumers

If the consumer has remained resilient, as evidenced by economic data and corporate sales, public retailer equities have been anything but. The retailers are down 29% to date, compared to the broad S&P 1500 and S&P 500—both down 14% year to date. Retailing is typically a competitive, lower margin business, and stocks typically trade on earnings expectations. Rolling forward (next 12 months) EPS estimates for the industry group have declined about 11% from the start of the year [Figure 3], and current year quarterly earnings have been a mixed bag of positive surprises and newsworthy stumbles. “Big Box” stores (aka multiline retail) have seen some of the larger earnings misses, as changing consumer behaviors coming out of the pandemic left stores with bloated inventories of pandemic favorites such as exercise bikes and patio furniture.

chart 3

An Early Happy New Year

We’re now in the homestretch of 2022. It’s been a challenging year for both stocks and bonds as inflation soared, interest rates climbed, and the Federal Reserve executed one of its most aggressive rate hike campaigns on record.  Ultimately, the economy, earnings, and the policy environment drive stock returns, not seasonal factors, but seasonals provide an important backdrop. And right now, the outlook based solely on seasonals is about as supportive as it gets (For our broader market view of 2023, see our Outlook 2023: Finding Balance).  But even if only a potential small tailwind, we hope the seasonal outlook helps us put a rough year behind us and gives us reason to say an early Happy New Year.

Adam Turnquist, CMT, Chief Technical Strategist, LPL Financial

Barry Gilbert, PhD, CFA, Asset Allocation Strategist, LPL Financial

LPL Weekly Market Commentary December 5, 2022

Economic and corporate data support the initial strong reads on holiday retail sales despite the macro headwinds, reinforcing the idea that today’s consumer is in a better position than usual at this point in the business cycle. However, consumers were likely tapping into credit and using savings to support spending. In this week’s Weekly Market Commentary we share insights on publicly traded retailers, analyze their underperformance year to date, and look forward to 2023.

Will a Resilient Consumer Support Holiday Retail?

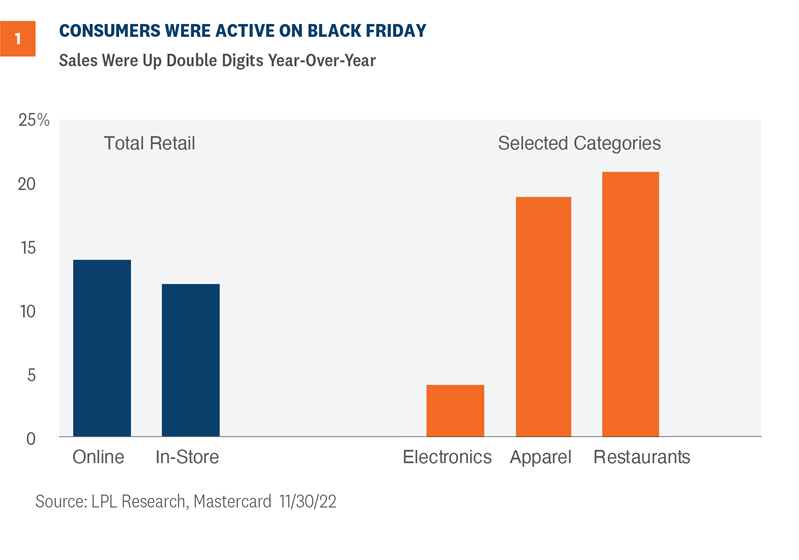
Consumer behavior during the Thanksgiving weekend is often a good predictor of overall holiday sales and the recent data point to growth this year. Consumers came out in droves on Black Friday, pushing nominal retail sales up over 10% from a year ago in both online and brick and mortar stores [Figure 1]. Elevated inflation this past year appeared to marginally impact the consumer but despite high prices, consumers were active on the Friday after Thanksgiving. Consumers were especially interested in heading to restaurants after Thanksgiving Day – spending at restaurants was over 20% above last Black Friday, partially driven by higher food prices but also supported by a resilient consumer. 

chart 1 consumers were active on black friday

Retail Sales Data Supports Initial Holiday Shopping Trends

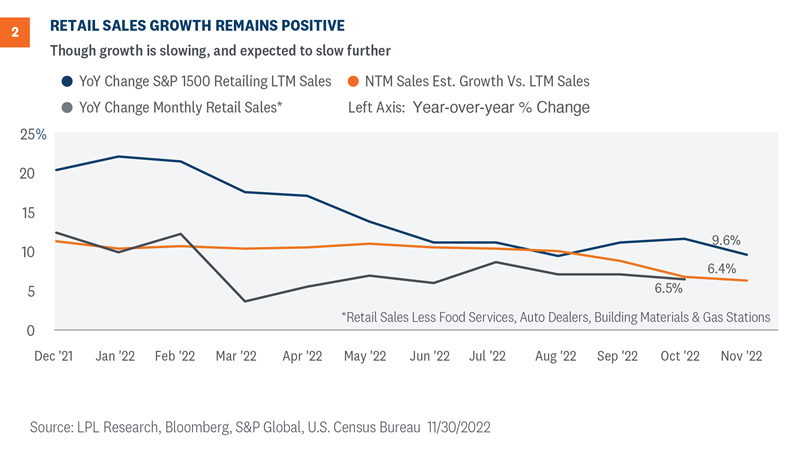
Economic and corporate data support the initial strong reads on holiday retail sales despite the macro headwinds, reinforcing the idea that today’s consumer is in a better position than usual at this point in the business cycle. Retail sales data from the Census Bureau (we focus on the Retail Sales excluding Food Service, Autos, Building Materials, and Gas Stations statistics) has shown year-over-year growth, slow from the average mid-teens numbers seen in 2021, to a still healthy upper-single digits number in 2022 [Figure 2]. The most recent read from October 2022 came in at 6.5%, above the long-term trend.

Reported sales from public retailers tell a similar story, and we see this data generally tracks the Census Bureau’s measure over time. We analyzed the S&P 1500 retailing industry group index, a cap weighted index of roughly 70 publicly traded U.S. retailers that is a slice of the broader consumer discretionary sector, and includes large, mid, and small cap companies. The year-over-year growth of trailing 12 month sales per share has slowed to 9.6%, down from the 20% pandemic rebound growth figures in 2021 and into 2022, but still slightly above the long-term trend of 8.5% over the last 20 years, pre-2020.

Forward-looking sales estimates paint a more subdued picture, which makes sense given the macro headwinds facing the economy and the consumer. However, the estimate for S&P 1500 retailing index’s next 12 months sales per share does imply 6.4% growth compared with the current reported last 12 months sales per share, and given the expectations for goods inflation this is not simply reflecting higher costs. Simply put, analysts are forecasting a slowdown in retail sales, but forecasts do not imply negative real growth. 

chart 2 retail sales growth remains positive

Retail Stocks Not as Resilient as Consumers

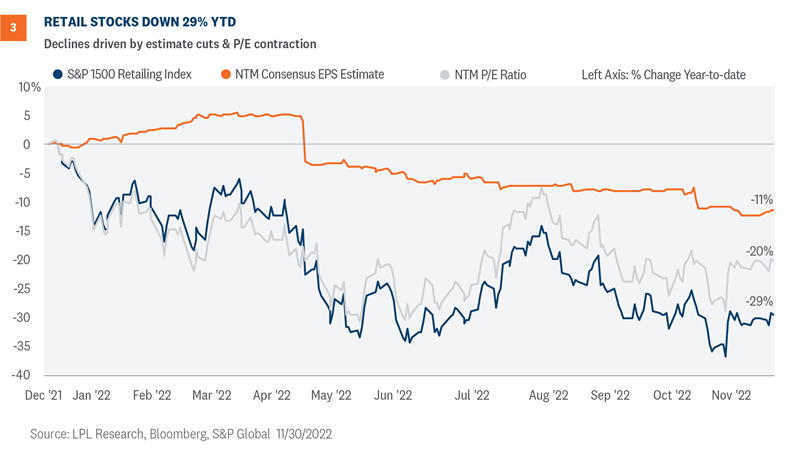
If the consumer has remained resilient, as evidenced by economic data and corporate sales, public retailer equities have been anything but. The retailers are down 29% to date, compared to the broad S&P 1500 and S&P 500—both down 14% year to date. Retailing is typically a competitive, lower margin business, and stocks typically trade on earnings expectations. Rolling forward (next 12 months) EPS estimates for the industry group have declined about 11% from the start of the year [Figure 3], and current year quarterly earnings have been a mixed bag of positive surprises and newsworthy stumbles. “Big Box” stores (aka multiline retail) have seen some of the larger earnings misses, as changing consumer behaviors coming out of the pandemic left stores with bloated inventories of pandemic favorites such as exercise bikes and patio furniture.

chart 3 retail stocks down 29% ytd

Looking forward and beyond inventory clearing discounts, input costs are also pressuring retail margins and earnings, namely labor costs. Retail wages, as measured by the Employment Cost Index from the Bureau of Labor Statistics, were up 7.2% year over year in the third quarter of 2022. This is down slightly from 7.6% in Q2 2022, but still among the highest reads across the entire labor market. Add in the increased cost of merchandise and goods, and the decline in EPS estimates is not surprising, as there is only so much retailers can pass on to consumers in the form of higher prices.

Retailer valuations have also taken a hit, as the forward (next 12 months) P/E multiple has contracted ~20% year to date, from ~27x to ~22x currently. Multiples typically expand and contract through the business cycle, and at a company specific level, growth and returns are generally the metrics to analyze. We have covered both: slowing growth and declining returns (measured by falling earnings). Decomposing the year to date returns, we roughly get to the 29% decline by multiplying falling earnings estimates by the contracted earnings multiple.

Conclusion

Low unemployment and rising wages support consumer spending during this holiday season. Despite historically high inflation rates and an aggressive Federal Reserve, consumer demand is holding up in 2022. Risks are rising for 2023 as consumers are likely tapping credit and personal savings to keep up spending habits.

Despite consumer spending and retail sales holding up relatively well in 2022, publicly traded retailers’ stocks have looked forward and underperformed. Retail stocks, measured via the retailing industry group, have declined more than most industry groups in both the S&P 1500 and S&P 500, delivering the fifth worst performance among 24 industry groups.

Inflationary pressures and changing consumer habits have eaten into profits and forward profit expectations, while the slowing growth outlook has re-rated market multiples downward.

Going forward, we are cautious on the broader consumer discretionary sector, where the retailing industry group resides. The expected slowdown in 2023, even a mild slowdown, will ultimately lead to a pullback in discretionary spending and sales at retailers. Large publicly traded retailers will not be immune from this pullback, though they may have levers to pull to subdue margin degradation. However, even if current earnings expectations for next year are correct, we see limited upside near term. The LPL Research Strategic & Tactical Asset Allocation Committee (STAAC) continues to hold a cautious view and an underweight to the S&P 500 consumer discretionary sector, from an asset allocation perspective.

Faster than expected deceleration in inflation and the economy avoiding a recession altogether (i.e., a  “soft landing”) could lead to a more constructive environment for retailing equities. 

Jeffrey Roach, PhD, Chief Economist, LPL Financial

Thomas Shipp, CFA, Quantitative Equity Analyst, LPL Financial